Ctrl+K
Logo image Logo image
  • Tipi di trama
  • Esempi
  • Tutorial
  • Riferimento API
  • Guida dell'utente
  • Contribuire
  • Plot types
  • Examples
  • Tutorials
  • Reference
  • User guide
  • Develop
  • Release notes

Section Navigation

  • Di base
    • trama (x, y)
    • dispersione (x, y)
    • barra(x, altezza)
    • stelo (x, y)
    • passo(x,y)
    • riempimento_tra(x, y1, y2)
    • stackplot(x, y)
  • Grafici di array e campi
    • immostra(Z)
    • pcolormesh(X, Y, Z)
    • contorno(X, Y, Z)
    • contornof(X, Y, Z)
    • punte (X, Y, U, V)
    • faretra(X, Y, U, V)
    • diagramma di flusso (X, Y, U, V)
  • Trame statistiche
    • storia(x)
    • grafico a scatole(X)
    • barra degli errori(x, y, yerr, xerr)
    • trama del violino (D)
    • trama degli eventi(D)
    • ist2d(x, y)
    • hexbin(x, y, C)
    • torta(x)
  • Coordinate non strutturate
    • tricontorno(x, y, z)
    • tricontorno(x, y, z)
    • triplo colore(x, y, z)
    • triplotto(x, y)

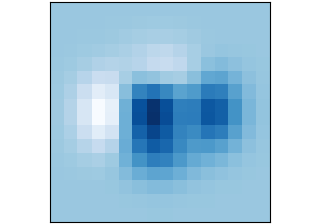
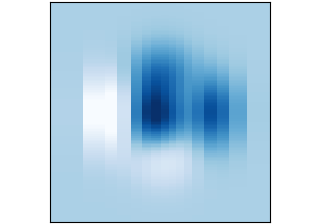
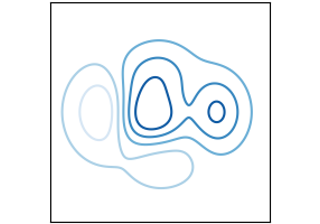
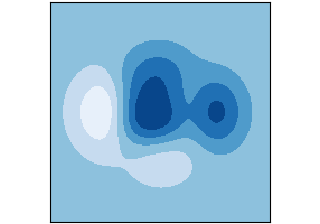
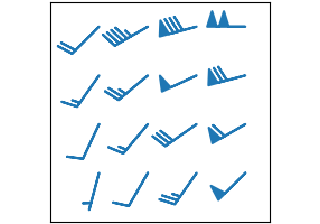
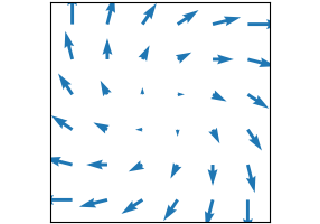
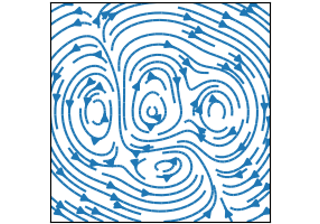
Grafici di array e campi #

Tracciare per matrici di dati e campi .Z(x, y)U(x, y), V(x, y)

immostra(Z)

immostra(Z)

immostra(Z)
pcolormesh(X, Y, Z)

pcolormesh(X, Y, Z)

pcolormesh(X, Y, Z)
contorno(X, Y, Z)

contorno(X, Y, Z)

contorno(X, Y, Z)
contornof(X, Y, Z)

contornof(X, Y, Z)

contornof(X, Y, Z)
punte (X, Y, U, V)

punte (X, Y, U, V)

punte (X, Y, U, V)
faretra(X, Y, U, V)

faretra(X, Y, U, V)

faretra(X, Y, U, V)
diagramma di flusso (X, Y, U, V)

diagramma di flusso (X, Y, U, V)

diagramma di flusso (X, Y, U, V)
Mostra fonte

© Copyright 2002–2012 John Hunter, Darren Dale, Eric Firing, Michael Droettboom and the Matplotlib development team; 2012–2022 The Matplotlib development team.

Created using Sphinx 5.1.1.