Nota
Fare clic qui per scaricare il codice di esempio completo
Limiti di visualizzazione #
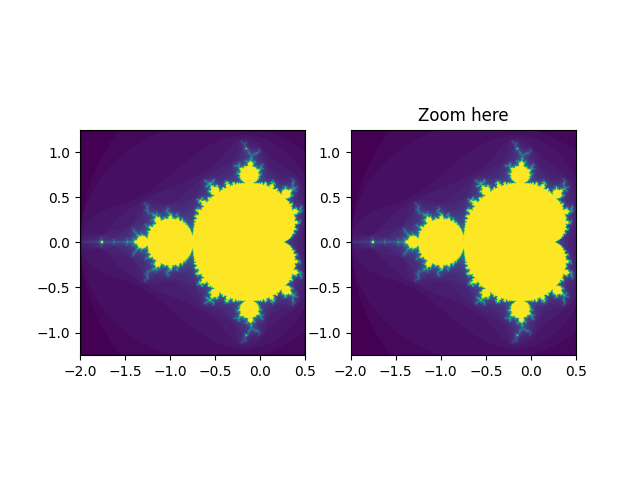
Crea due pannelli identici. Lo zoom avanti sul pannello di destra mostrerà un rettangolo nel primo pannello, che denota la regione ingrandita.
Nota
Questo esempio esercita le capacità interattive di Matplotlib e questo non apparirà nella documentazione statica. Esegui questo codice sulla tua macchina per vedere l'interattività.
Puoi copiare e incollare singole parti o scaricare l'intero esempio utilizzando il link in fondo alla pagina.

import numpy as np
import matplotlib.pyplot as plt
from matplotlib.patches import Rectangle


# We just subclass Rectangle so that it can be called with an Axes
# instance, causing the rectangle to update its shape to match the
# bounds of the Axes
class UpdatingRect(Rectangle):
    def __call__(self, ax):
        self.set_bounds(*ax.viewLim.bounds)
        ax.figure.canvas.draw_idle()


# A class that will regenerate a fractal set as we zoom in, so that you
# can actually see the increasing detail.  A box in the left panel will show
# the area to which we are zoomed.
class MandelbrotDisplay:
    def __init__(self, h=500, w=500, niter=50, radius=2., power=2):
        self.height = h
        self.width = w
        self.niter = niter
        self.radius = radius
        self.power = power

    def compute_image(self, xstart, xend, ystart, yend):
        self.x = np.linspace(xstart, xend, self.width)
        self.y = np.linspace(ystart, yend, self.height).reshape(-1, 1)
        c = self.x + 1.0j * self.y
        threshold_time = np.zeros((self.height, self.width))
        z = np.zeros(threshold_time.shape, dtype=complex)
        mask = np.ones(threshold_time.shape, dtype=bool)
        for i in range(self.niter):
            z[mask] = z[mask]**self.power + c[mask]
            mask = (np.abs(z) < self.radius)
            threshold_time += mask
        return threshold_time

    def ax_update(self, ax):
        ax.set_autoscale_on(False)  # Otherwise, infinite loop
        # Get the number of points from the number of pixels in the window
        self.width, self.height = \
            np.round(ax.patch.get_window_extent().size).astype(int)
        # Get the range for the new area
        vl = ax.viewLim
        extent = vl.x0, vl.x1, vl.y0, vl.y1
        # Update the image object with our new data and extent
        im = ax.images[-1]
        im.set_data(self.compute_image(*extent))
        im.set_extent(extent)
        ax.figure.canvas.draw_idle()


md = MandelbrotDisplay()
Z = md.compute_image(-2., 0.5, -1.25, 1.25)

fig1, (ax1, ax2) = plt.subplots(1, 2)
ax1.imshow(Z, origin='lower',
           extent=(md.x.min(), md.x.max(), md.y.min(), md.y.max()))
ax2.imshow(Z, origin='lower',
           extent=(md.x.min(), md.x.max(), md.y.min(), md.y.max()))

rect = UpdatingRect(
    [0, 0], 0, 0, facecolor='none', edgecolor='black', linewidth=1.0)
rect.set_bounds(*ax2.viewLim.bounds)
ax1.add_patch(rect)

# Connect for changing the view limits
ax2.callbacks.connect('xlim_changed', rect)
ax2.callbacks.connect('ylim_changed', rect)

ax2.callbacks.connect('xlim_changed', md.ax_update)
ax2.callbacks.connect('ylim_changed', md.ax_update)
ax2.set_title("Zoom here")

plt.show()