Nota
Fare clic qui per scaricare il codice di esempio completo
Gestione unità #
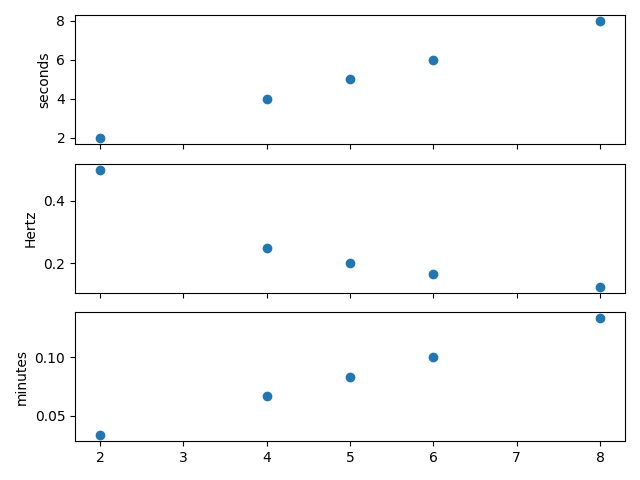
L'esempio seguente mostra il supporto per le conversioni di unità su matrici mascherate.
Questo esempio richiedebasic_units.py

import numpy as np
import matplotlib.pyplot as plt
from basic_units import secs, hertz, minutes

# create masked array
data = (1, 2, 3, 4, 5, 6, 7, 8)
mask = (1, 0, 1, 0, 0, 0, 1, 0)
xsecs = secs * np.ma.MaskedArray(data, mask, float)

fig, (ax1, ax2, ax3) = plt.subplots(nrows=3, sharex=True)

ax1.scatter(xsecs, xsecs)
ax1.yaxis.set_units(secs)
ax2.scatter(xsecs, xsecs, yunits=hertz)
ax3.scatter(xsecs, xsecs, yunits=minutes)

fig.tight_layout()
plt.show()