Nota
Fare clic qui per scaricare il codice di esempio completo
Dimostrazione GridSpec n.
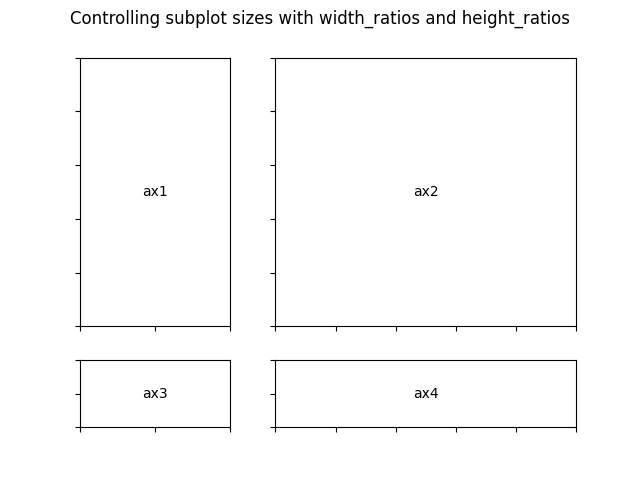
Questo esempio dimostra l'uso di GridSpecper generare sottotrame, il controllo delle dimensioni relative delle sottotrame con width_ratios e
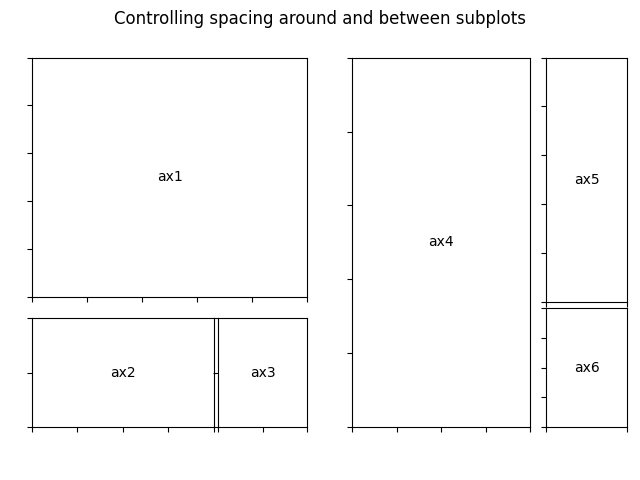
height_ratios e il controllo della spaziatura attorno e tra le sottotrame utilizzando i parametri di sottotrama ( left , right , bottom , top , wspace e
hspace ) .
import matplotlib.pyplot as plt
from matplotlib.gridspec import GridSpec


def annotate_axes(fig):
    for i, ax in enumerate(fig.axes):
        ax.text(0.5, 0.5, "ax%d" % (i+1), va="center", ha="center")
        ax.tick_params(labelbottom=False, labelleft=False)


fig = plt.figure()
fig.suptitle("Controlling subplot sizes with width_ratios and height_ratios")

gs = GridSpec(2, 2, width_ratios=[1, 2], height_ratios=[4, 1])
ax1 = fig.add_subplot(gs[0])
ax2 = fig.add_subplot(gs[1])
ax3 = fig.add_subplot(gs[2])
ax4 = fig.add_subplot(gs[3])

annotate_axes(fig)

fig = plt.figure()
fig.suptitle("Controlling spacing around and between subplots")

gs1 = GridSpec(3, 3, left=0.05, right=0.48, wspace=0.05)
ax1 = fig.add_subplot(gs1[:-1, :])
ax2 = fig.add_subplot(gs1[-1, :-1])
ax3 = fig.add_subplot(gs1[-1, -1])

gs2 = GridSpec(3, 3, left=0.55, right=0.98, hspace=0.05)
ax4 = fig.add_subplot(gs2[:, :-1])
ax5 = fig.add_subplot(gs2[:-1, -1])
ax6 = fig.add_subplot(gs2[-1, -1])

annotate_axes(fig)

plt.show()
