Nota
Fare clic qui per scaricare il codice di esempio completo
Grafico a dispersione con istogrammi #
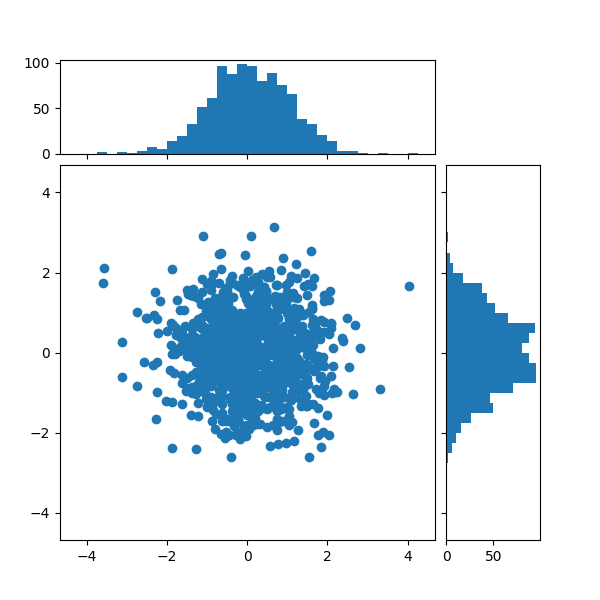
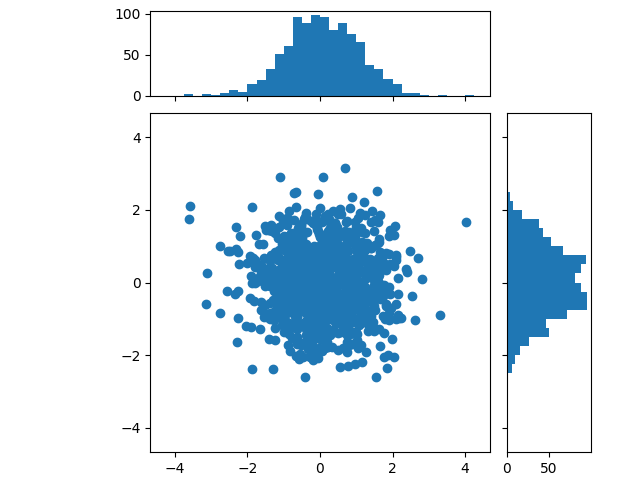
Mostra le distribuzioni marginali di un grafico a dispersione come istogrammi ai lati del grafico.
Per un buon allineamento degli assi principali con i marginali, di seguito sono mostrate due opzioni:
Sebbene Axes.inset_axespossa essere un po' più complesso, consente la corretta gestione degli assi principali con proporzioni fisse.
Un metodo alternativo per produrre una figura simile utilizzando il axes_grid1
toolkit è mostrato nell'esempio Istogramma a dispersione (assi individuabili)
. Infine, è anche possibile posizionare tutti gli assi in coordinate assolute usando Figure.add_axes(non mostrato qui).
Definiamo prima una funzione che accetta i dati x e y come input, oltre a tre assi, gli assi principali per la dispersione e due assi marginali. Creerà quindi lo scatter e gli istogrammi all'interno degli assi forniti.
import numpy as np
import matplotlib.pyplot as plt

# Fixing random state for reproducibility
np.random.seed(19680801)

# some random data
x = np.random.randn(1000)
y = np.random.randn(1000)


def scatter_hist(x, y, ax, ax_histx, ax_histy):
    # no labels
    ax_histx.tick_params(axis="x", labelbottom=False)
    ax_histy.tick_params(axis="y", labelleft=False)

    # the scatter plot:
    ax.scatter(x, y)

    # now determine nice limits by hand:
    binwidth = 0.25
    xymax = max(np.max(np.abs(x)), np.max(np.abs(y)))
    lim = (int(xymax/binwidth) + 1) * binwidth

    bins = np.arange(-lim, lim + binwidth, binwidth)
    ax_histx.hist(x, bins=bins)
    ax_histy.hist(y, bins=bins, orientation='horizontal')
Definire le posizioni degli assi usando un gridspec #
Definiamo una griglia con rapporti di larghezza e altezza diversi per ottenere il layout desiderato. Vedi anche l' esercitazione Disposizione di più assi in una figura .
# Start with a square Figure.
fig = plt.figure(figsize=(6, 6))
# Add a gridspec with two rows and two columns and a ratio of 1 to 4 between
# the size of the marginal axes and the main axes in both directions.
# Also adjust the subplot parameters for a square plot.
gs = fig.add_gridspec(2, 2,  width_ratios=(4, 1), height_ratios=(1, 4),
                      left=0.1, right=0.9, bottom=0.1, top=0.9,
                      wspace=0.05, hspace=0.05)
# Create the Axes.
ax = fig.add_subplot(gs[1, 0])
ax_histx = fig.add_subplot(gs[0, 0], sharex=ax)
ax_histy = fig.add_subplot(gs[1, 1], sharey=ax)
# Draw the scatter plot and marginals.
scatter_hist(x, y, ax, ax_histx, ax_histy)

Definire le posizioni degli assi usando inset_axes #
inset_axespuò essere utilizzato per posizionare i margini al di fuori degli assi principali. Il vantaggio di questa operazione è che le proporzioni degli assi principali possono essere fissate ei margini saranno sempre disegnati rispetto alla posizione degli assi.
# Create a Figure, which doesn't have to be square.
fig = plt.figure(constrained_layout=True)
# Create the main axes, leaving 25% of the figure space at the top and on the
# right to position marginals.
ax = fig.add_gridspec(top=0.75, right=0.75).subplots()
# The main axes' aspect can be fixed.
ax.set(aspect=1)
# Create marginal axes, which have 25% of the size of the main axes.  Note that
# the inset axes are positioned *outside* (on the right and the top) of the
# main axes, by specifying axes coordinates greater than 1.  Axes coordinates
# less than 0 would likewise specify positions on the left and the bottom of
# the main axes.
ax_histx = ax.inset_axes([0, 1.05, 1, 0.25], sharex=ax)
ax_histy = ax.inset_axes([1.05, 0, 0.25, 1], sharey=ax)
# Draw the scatter plot and marginals.
scatter_hist(x, y, ax, ax_histx, ax_histy)

plt.show()

Riferimenti
L'uso delle seguenti funzioni, metodi, classi e moduli è mostrato in questo esempio:
Tempo di esecuzione totale dello script: (0 minuti 1,217 secondi)