Nota
Fare clic qui per scaricare il codice di esempio completo
Unisci la trasparenza al colore nelle immagini 2D #
Unisci la trasparenza al colore per evidenziare parti di dati con imshow.
Un uso comune per matplotlib.pyplot.imshowè tracciare una mappa statistica 2D. La funzione semplifica la visualizzazione di una matrice 2D come immagine e aggiunge trasparenza all'output. Ad esempio, è possibile tracciare una statistica (come una statistica t) e colorare la trasparenza di ciascun pixel in base al suo valore p. Questo esempio mostra come ottenere questo effetto.
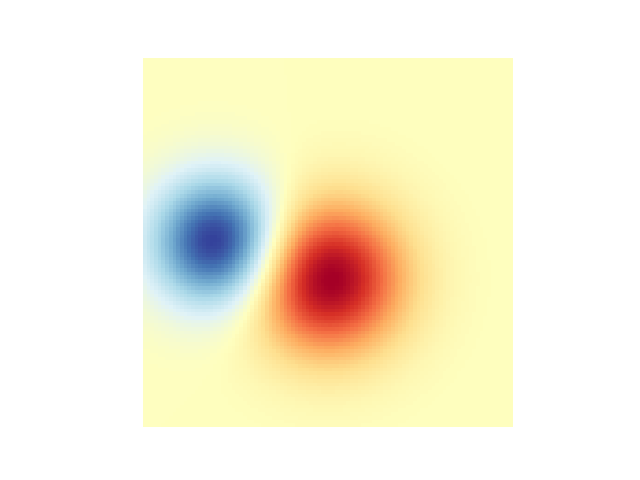
Per prima cosa genereremo alcuni dati, in questo caso creeremo due "blob" 2D in una griglia 2D. Un blob sarà positivo e l'altro negativo.
import numpy as np
import matplotlib.pyplot as plt
from matplotlib.colors import Normalize


def normal_pdf(x, mean, var):
    return np.exp(-(x - mean)**2 / (2*var))


# Generate the space in which the blobs will live
xmin, xmax, ymin, ymax = (0, 100, 0, 100)
n_bins = 100
xx = np.linspace(xmin, xmax, n_bins)
yy = np.linspace(ymin, ymax, n_bins)

# Generate the blobs. The range of the values is roughly -.0002 to .0002
means_high = [20, 50]
means_low = [50, 60]
var = [150, 200]

gauss_x_high = normal_pdf(xx, means_high[0], var[0])
gauss_y_high = normal_pdf(yy, means_high[1], var[0])

gauss_x_low = normal_pdf(xx, means_low[0], var[1])
gauss_y_low = normal_pdf(yy, means_low[1], var[1])

weights = (np.outer(gauss_y_high, gauss_x_high)
           - np.outer(gauss_y_low, gauss_x_low))

# We'll also create a grey background into which the pixels will fade
greys = np.full((*weights.shape, 3), 70, dtype=np.uint8)

# First we'll plot these blobs using ``imshow`` without transparency.
vmax = np.abs(weights).max()
imshow_kwargs = {
    'vmax': vmax,
    'vmin': -vmax,
    'cmap': 'RdYlBu',
    'extent': (xmin, xmax, ymin, ymax),
}

fig, ax = plt.subplots()
ax.imshow(greys)
ax.imshow(weights, **imshow_kwargs)
ax.set_axis_off()

Fusione in trasparenza #
Il modo più semplice per includere la trasparenza quando si tracciano i dati
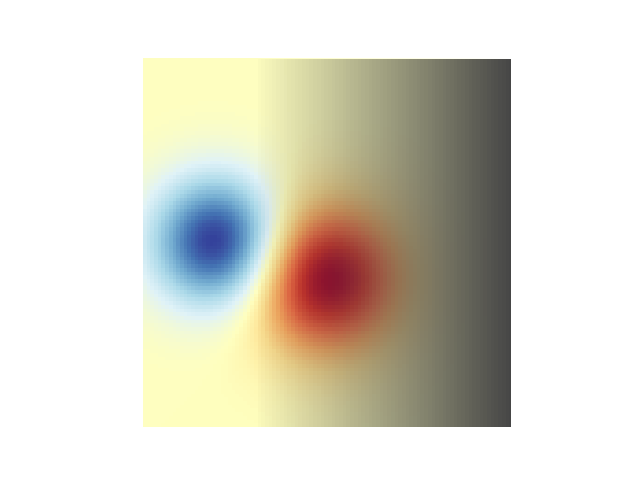
matplotlib.pyplot.imshowè passare un array che corrisponda alla forma dei dati alphaall'argomento. Ad esempio, creeremo un gradiente che si sposta da sinistra a destra in basso.
# Create an alpha channel of linearly increasing values moving to the right.
alphas = np.ones(weights.shape)
alphas[:, 30:] = np.linspace(1, 0, 70)

# Create the figure and image
# Note that the absolute values may be slightly different
fig, ax = plt.subplots()
ax.imshow(greys)
ax.imshow(weights, alpha=alphas, **imshow_kwargs)
ax.set_axis_off()

Utilizzo della trasparenza per evidenziare i valori con ampiezza elevata #
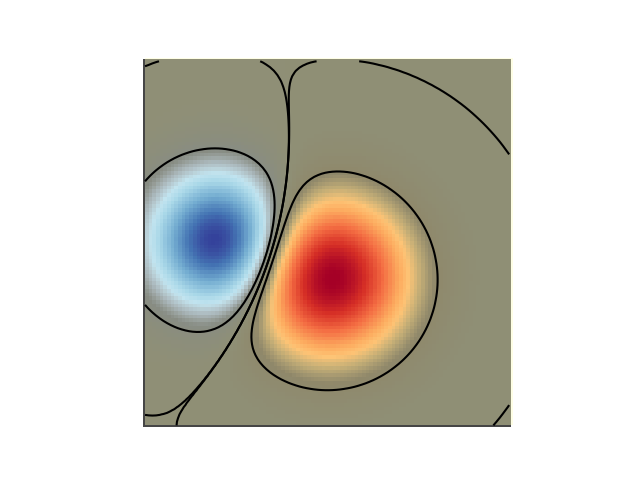
Infine, ricreeremo lo stesso grafico, ma questa volta utilizzeremo la trasparenza per evidenziare i valori estremi nei dati. Questo è spesso usato per evidenziare i punti dati con valori p più piccoli. Aggiungeremo anche le linee di contorno per evidenziare i valori dell'immagine.
# Create an alpha channel based on weight values
# Any value whose absolute value is > .0001 will have zero transparency
alphas = Normalize(0, .3, clip=True)(np.abs(weights))
alphas = np.clip(alphas, .4, 1)  # alpha value clipped at the bottom at .4

# Create the figure and image
# Note that the absolute values may be slightly different
fig, ax = plt.subplots()
ax.imshow(greys)
ax.imshow(weights, alpha=alphas, **imshow_kwargs)

# Add contour lines to further highlight different levels.
ax.contour(weights[::-1], levels=[-.1, .1], colors='k', linestyles='-')
ax.set_axis_off()
plt.show()

ax.contour(weights[::-1], levels=[-.0001, .0001], colors='k', linestyles='-')
ax.set_axis_off()
plt.show()

Riferimenti
L'uso delle seguenti funzioni, metodi, classi e moduli è mostrato in questo esempio: