Nota
Fare clic qui per scaricare il codice di esempio completo
Più sottotrame #
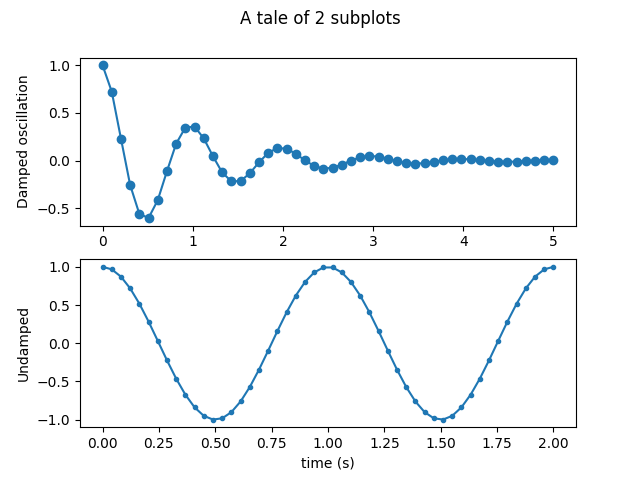
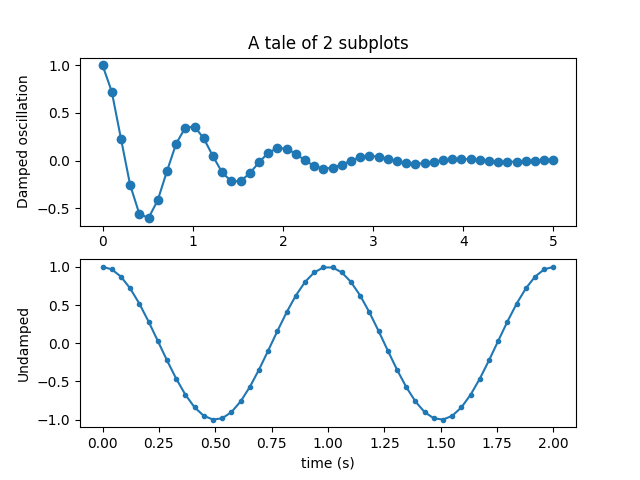
Demo semplice con più sottotrame.
Per ulteriori opzioni, consulta Creazione di più sottotrame utilizzando plt.subplots .
subplots()è il metodo consigliato per generare semplici arrangiamenti di sottotrame:
fig, (ax1, ax2) = plt.subplots(2, 1)
fig.suptitle('A tale of 2 subplots')

ax1.plot(x1, y1, 'o-')
ax1.set_ylabel('Damped oscillation')

ax2.plot(x2, y2, '.-')
ax2.set_xlabel('time (s)')
ax2.set_ylabel('Undamped')

plt.show()

Le sottotrame possono anche essere generate una alla volta usando subplot():
plt.subplot(2, 1, 1)
plt.plot(x1, y1, 'o-')
plt.title('A tale of 2 subplots')
plt.ylabel('Damped oscillation')

plt.subplot(2, 1, 2)
plt.plot(x2, y2, '.-')
plt.xlabel('time (s)')
plt.ylabel('Undamped')

plt.show()
