Nota
Fare clic qui per scaricare il codice di esempio completo
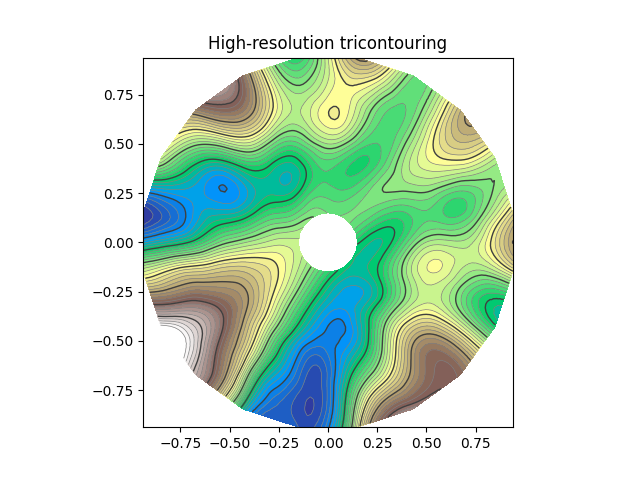
Tricontour Smooth Utente n.
Dimostra il tricontouring ad alta risoluzione su griglie triangolari definite dall'utente con matplotlib.tri.UniformTriRefiner.
import matplotlib.tri as tri
import matplotlib.pyplot as plt
import numpy as np


# ----------------------------------------------------------------------------
# Analytical test function
# ----------------------------------------------------------------------------
def function_z(x, y):
    r1 = np.sqrt((0.5 - x)**2 + (0.5 - y)**2)
    theta1 = np.arctan2(0.5 - x, 0.5 - y)
    r2 = np.sqrt((-x - 0.2)**2 + (-y - 0.2)**2)
    theta2 = np.arctan2(-x - 0.2, -y - 0.2)
    z = -(2 * (np.exp((r1 / 10)**2) - 1) * 30. * np.cos(7. * theta1) +
          (np.exp((r2 / 10)**2) - 1) * 30. * np.cos(11. * theta2) +
          0.7 * (x**2 + y**2))
    return (np.max(z) - z) / (np.max(z) - np.min(z))

# ----------------------------------------------------------------------------
# Creating a Triangulation
# ----------------------------------------------------------------------------
# First create the x and y coordinates of the points.
n_angles = 20
n_radii = 10
min_radius = 0.15
radii = np.linspace(min_radius, 0.95, n_radii)

angles = np.linspace(0, 2 * np.pi, n_angles, endpoint=False)
angles = np.repeat(angles[..., np.newaxis], n_radii, axis=1)
angles[:, 1::2] += np.pi / n_angles

x = (radii * np.cos(angles)).flatten()
y = (radii * np.sin(angles)).flatten()
z = function_z(x, y)

# Now create the Triangulation.
# (Creating a Triangulation without specifying the triangles results in the
# Delaunay triangulation of the points.)
triang = tri.Triangulation(x, y)

# Mask off unwanted triangles.
triang.set_mask(np.hypot(x[triang.triangles].mean(axis=1),
                         y[triang.triangles].mean(axis=1))
                < min_radius)

# ----------------------------------------------------------------------------
# Refine data
# ----------------------------------------------------------------------------
refiner = tri.UniformTriRefiner(triang)
tri_refi, z_test_refi = refiner.refine_field(z, subdiv=3)

# ----------------------------------------------------------------------------
# Plot the triangulation and the high-res iso-contours
# ----------------------------------------------------------------------------
fig, ax = plt.subplots()
ax.set_aspect('equal')
ax.triplot(triang, lw=0.5, color='white')

levels = np.arange(0., 1., 0.025)
ax.tricontourf(tri_refi, z_test_refi, levels=levels, cmap='terrain')
ax.tricontour(tri_refi, z_test_refi, levels=levels,
              colors=['0.25', '0.5', '0.5', '0.5', '0.5'],
              linewidths=[1.0, 0.5, 0.5, 0.5, 0.5])

ax.set_title("High-resolution tricontouring")

plt.show()
Riferimenti
L'uso delle seguenti funzioni, metodi, classi e moduli è mostrato in questo esempio: