Nota
Fare clic qui per scaricare il codice di esempio completo
Formattatore tick personalizzato per serie temporali #
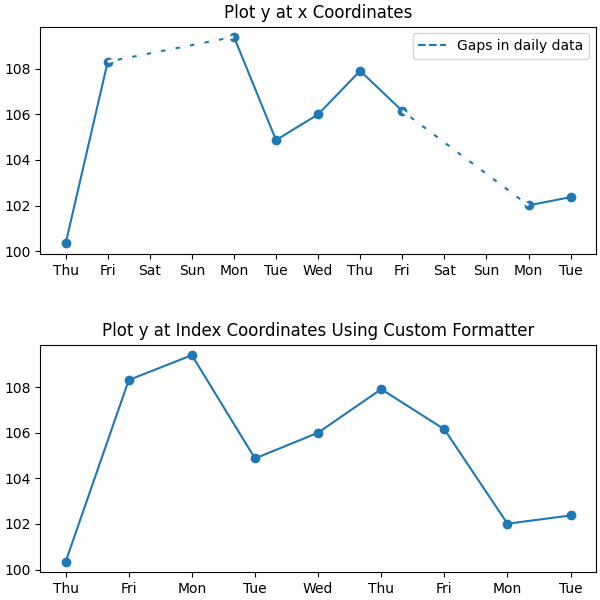
Quando si tracciano i dati giornalieri, ad esempio le serie temporali finanziarie, spesso si desidera omettere i giorni in cui non ci sono dati, ad esempio i fine settimana, in modo che i dati vengano tracciati a intervalli regolari senza spazi aggiuntivi per i giorni senza dati. L'esempio mostra come utilizzare un "formattatore di indice" per ottenere il grafico desiderato.
import numpy as np
import matplotlib.pyplot as plt
import matplotlib.cbook as cbook
import matplotlib.lines as ml
from matplotlib.dates import DateFormatter, DayLocator
from matplotlib.ticker import Formatter


# Load a numpy record array from yahoo csv data with fields date, open, high,
# low, close, volume, adj_close from the mpl-data/sample_data directory. The
# record array stores the date as an np.datetime64 with a day unit ('D') in
# the date column (``r.date``).
r = (cbook.get_sample_data('goog.npz', np_load=True)['price_data']
     .view(np.recarray))
r = r[:9]  # get the first 9 days

fig, (ax1, ax2) = plt.subplots(nrows=2, figsize=(6, 6),
                               constrained_layout={'hspace': .15})

# First we'll do it the default way, with gaps on weekends
ax1.plot(r.date, r.adj_close, 'o-')

# Highlight gaps in daily data
gaps = np.flatnonzero(np.diff(r.date) > np.timedelta64(1, 'D'))
for gap in r[['date', 'adj_close']][np.stack((gaps, gaps + 1)).T]:
    ax1.plot(gap.date, gap.adj_close, 'w--', lw=2)
ax1.legend(handles=[ml.Line2D([], [], ls='--', label='Gaps in daily data')])

ax1.set_title("Plot y at x Coordinates")
ax1.xaxis.set_major_locator(DayLocator())
ax1.xaxis.set_major_formatter(DateFormatter('%a'))


# Next we'll write a custom index formatter. Below we will plot
# the data against an index that goes from 0, 1,  ... len(data).  Instead of
# formatting the tick marks as integers, we format as times.
def format_date(x, _):
    try:
        # convert datetime64 to datetime, and use datetime's strftime:
        return r.date[round(x)].item().strftime('%a')
    except IndexError:
        pass

# Create an index plot (x defaults to range(len(y)) if omitted)
ax2.plot(r.adj_close, 'o-')

ax2.set_title("Plot y at Index Coordinates Using Custom Formatter")
ax2.xaxis.set_major_formatter(format_date)  # internally creates FuncFormatter

Invece di passare una funzione Axis.set_major_formatter, puoi usare qualsiasi altro callable, ad esempio un'istanza di una classe che implementa __call__:
class MyFormatter(Formatter):
    def __init__(self, dates, fmt='%a'):
        self.dates = dates
        self.fmt = fmt

    def __call__(self, x, pos=0):
        """Return the label for time x at position pos."""
        try:
            return self.dates[round(x)].item().strftime(self.fmt)
        except IndexError:
            pass


ax2.xaxis.set_major_formatter(MyFormatter(r.date, '%a'))