Nota
Fare clic qui per scaricare il codice di esempio completo
Dimostrazione della leggenda n.
Tracciare leggende in Matplotlib.
Esistono molti modi per creare e personalizzare le legende in Matplotlib. Di seguito mostreremo alcuni esempi su come farlo.
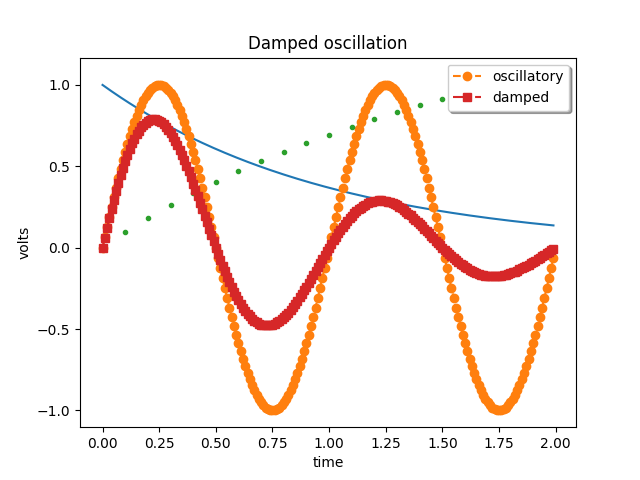
Per prima cosa mostreremo come creare una legenda per linee specifiche.
import matplotlib.pyplot as plt
import matplotlib.collections as mcol
from matplotlib.legend_handler import HandlerLineCollection, HandlerTuple
from matplotlib.lines import Line2D
import numpy as np

t1 = np.arange(0.0, 2.0, 0.1)
t2 = np.arange(0.0, 2.0, 0.01)

fig, ax = plt.subplots()

# note that plot returns a list of lines.  The "l1, = plot" usage
# extracts the first element of the list into l1 using tuple
# unpacking.  So l1 is a Line2D instance, not a sequence of lines
l1, = ax.plot(t2, np.exp(-t2))
l2, l3 = ax.plot(t2, np.sin(2 * np.pi * t2), '--o', t1, np.log(1 + t1), '.')
l4, = ax.plot(t2, np.exp(-t2) * np.sin(2 * np.pi * t2), 's-.')

ax.legend((l2, l4), ('oscillatory', 'damped'), loc='upper right', shadow=True)
ax.set_xlabel('time')
ax.set_ylabel('volts')
ax.set_title('Damped oscillation')
plt.show()
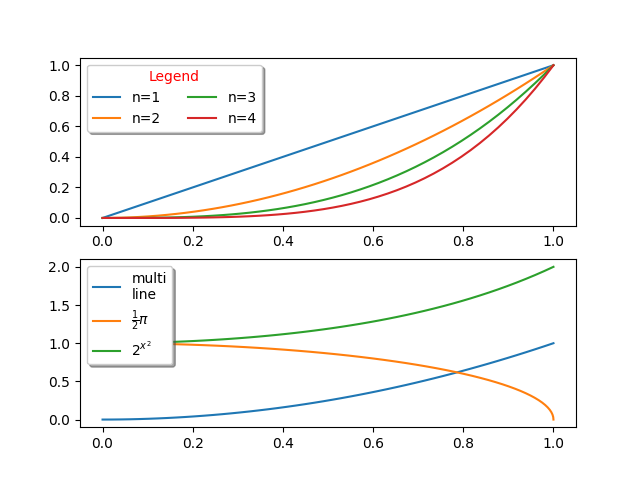
Successivamente dimostreremo la creazione di etichette più complesse.
x = np.linspace(0, 1)

fig, (ax0, ax1) = plt.subplots(2, 1)

# Plot the lines y=x**n for n=1..4.
for n in range(1, 5):
    ax0.plot(x, x**n, label="n={0}".format(n))
leg = ax0.legend(loc="upper left", bbox_to_anchor=[0, 1],
                 ncol=2, shadow=True, title="Legend", fancybox=True)
leg.get_title().set_color("red")

# Demonstrate some more complex labels.
ax1.plot(x, x**2, label="multi\nline")
half_pi = np.linspace(0, np.pi / 2)
ax1.plot(np.sin(half_pi), np.cos(half_pi), label=r"$\frac{1}{2}\pi$")
ax1.plot(x, 2**(x**2), label="$2^{x^2}$")
ax1.legend(shadow=True, fancybox=True)

plt.show()
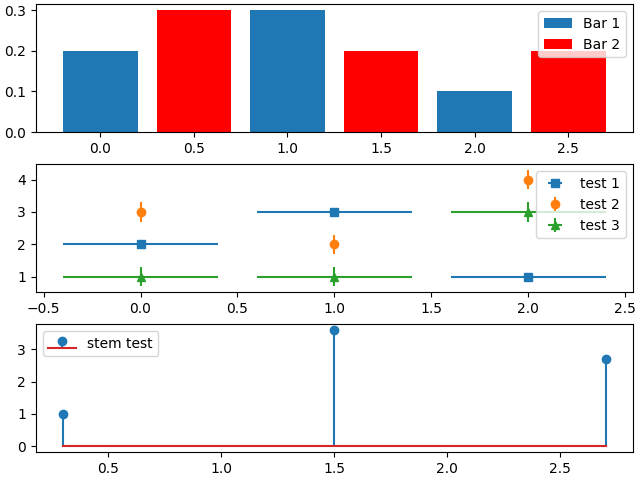
Qui alleghiamo leggende a trame più complesse.
fig, axs = plt.subplots(3, 1, constrained_layout=True)
top_ax, middle_ax, bottom_ax = axs

top_ax.bar([0, 1, 2], [0.2, 0.3, 0.1], width=0.4, label="Bar 1",
           align="center")
top_ax.bar([0.5, 1.5, 2.5], [0.3, 0.2, 0.2], color="red", width=0.4,
           label="Bar 2", align="center")
top_ax.legend()

middle_ax.errorbar([0, 1, 2], [2, 3, 1], xerr=0.4, fmt="s", label="test 1")
middle_ax.errorbar([0, 1, 2], [3, 2, 4], yerr=0.3, fmt="o", label="test 2")
middle_ax.errorbar([0, 1, 2], [1, 1, 3], xerr=0.4, yerr=0.3, fmt="^",
                   label="test 3")
middle_ax.legend()

bottom_ax.stem([0.3, 1.5, 2.7], [1, 3.6, 2.7], label="stem test")
bottom_ax.legend()

plt.show()
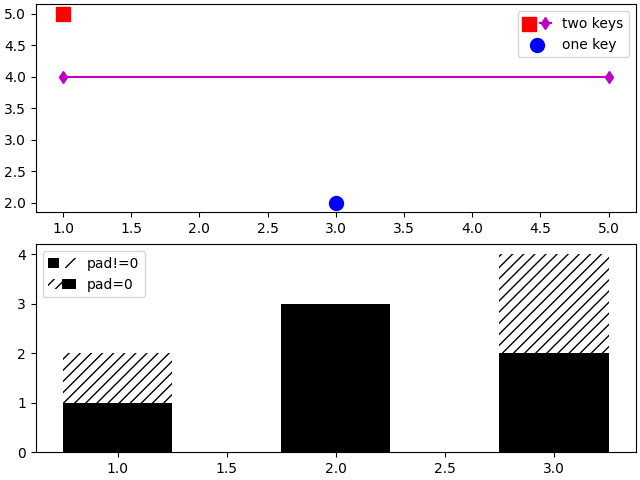
Ora mostreremo voci di legenda con più di una chiave di legenda.
fig, (ax1, ax2) = plt.subplots(2, 1, constrained_layout=True)

# First plot: two legend keys for a single entry
p1 = ax1.scatter([1], [5], c='r', marker='s', s=100)
p2 = ax1.scatter([3], [2], c='b', marker='o', s=100)
# `plot` returns a list, but we want the handle - thus the comma on the left
p3, = ax1.plot([1, 5], [4, 4], 'm-d')

# Assign two of the handles to the same legend entry by putting them in a tuple
# and using a generic handler map (which would be used for any additional
# tuples of handles like (p1, p3)).
l = ax1.legend([(p1, p3), p2], ['two keys', 'one key'], scatterpoints=1,
               numpoints=1, handler_map={tuple: HandlerTuple(ndivide=None)})

# Second plot: plot two bar charts on top of each other and change the padding
# between the legend keys
x_left = [1, 2, 3]
y_pos = [1, 3, 2]
y_neg = [2, 1, 4]

rneg = ax2.bar(x_left, y_neg, width=0.5, color='w', hatch='///', label='-1')
rpos = ax2.bar(x_left, y_pos, width=0.5, color='k', label='+1')

# Treat each legend entry differently by using specific `HandlerTuple`s
l = ax2.legend([(rpos, rneg), (rneg, rpos)], ['pad!=0', 'pad=0'],
               handler_map={(rpos, rneg): HandlerTuple(ndivide=None),
                            (rneg, rpos): HandlerTuple(ndivide=None, pad=0.)})
plt.show()
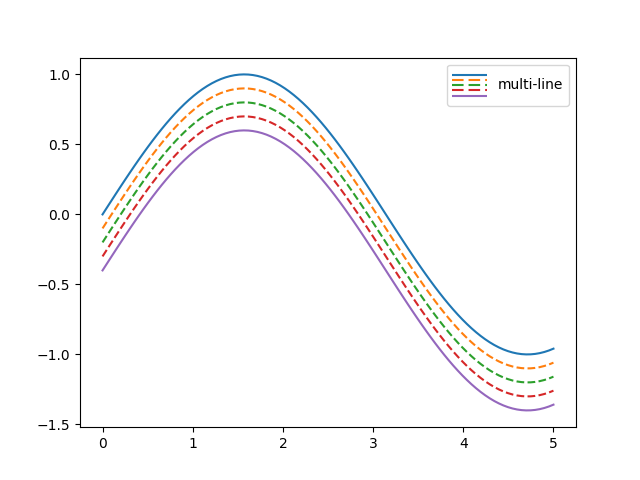
Infine, è anche possibile scrivere oggetti personalizzati che definiscono come stilizzare le legende.
class HandlerDashedLines(HandlerLineCollection):
    """
    Custom Handler for LineCollection instances.
    """
    def create_artists(self, legend, orig_handle,
                       xdescent, ydescent, width, height, fontsize, trans):
        # figure out how many lines there are
        numlines = len(orig_handle.get_segments())
        xdata, xdata_marker = self.get_xdata(legend, xdescent, ydescent,
                                             width, height, fontsize)
        leglines = []
        # divide the vertical space where the lines will go
        # into equal parts based on the number of lines
        ydata = np.full_like(xdata, height / (numlines + 1))
        # for each line, create the line at the proper location
        # and set the dash pattern
        for i in range(numlines):
            legline = Line2D(xdata, ydata * (numlines - i) - ydescent)
            self.update_prop(legline, orig_handle, legend)
            # set color, dash pattern, and linewidth to that
            # of the lines in linecollection
            try:
                color = orig_handle.get_colors()[i]
            except IndexError:
                color = orig_handle.get_colors()[0]
            try:
                dashes = orig_handle.get_dashes()[i]
            except IndexError:
                dashes = orig_handle.get_dashes()[0]
            try:
                lw = orig_handle.get_linewidths()[i]
            except IndexError:
                lw = orig_handle.get_linewidths()[0]
            if dashes[1] is not None:
                legline.set_dashes(dashes[1])
            legline.set_color(color)
            legline.set_transform(trans)
            legline.set_linewidth(lw)
            leglines.append(legline)
        return leglines

x = np.linspace(0, 5, 100)

fig, ax = plt.subplots()
colors = plt.rcParams['axes.prop_cycle'].by_key()['color'][:5]
styles = ['solid', 'dashed', 'dashed', 'dashed', 'solid']
lines = []
for i, color, style in zip(range(5), colors, styles):
    ax.plot(x, np.sin(x) - .1 * i, c=color, ls=style)

# make proxy artists
# make list of one line -- doesn't matter what the coordinates are
line = [[(0, 0)]]
# set up the proxy artist
lc = mcol.LineCollection(5 * line, linestyles=styles, colors=colors)
# create the legend
ax.legend([lc], ['multi-line'], handler_map={type(lc): HandlerDashedLines()},
          handlelength=2.5, handleheight=3)

plt.show()
Tempo di esecuzione totale dello script: (0 minuti 2,626 secondi)