Nota
Fare clic qui per scaricare il codice di esempio completo
Creazione di una sequenza temporale con linee, date e testo #
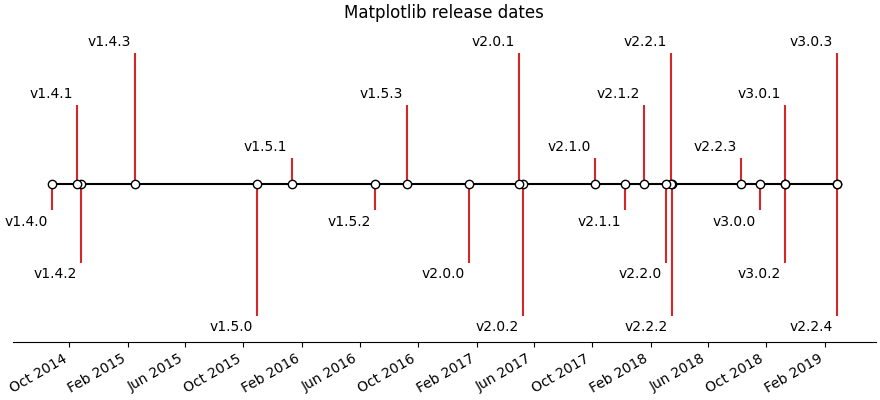
Come creare una semplice sequenza temporale utilizzando le date di rilascio di Matplotlib.
Le linee temporali possono essere create con una raccolta di date e testo. In questo esempio, mostriamo come creare una semplice sequenza temporale utilizzando le date per le versioni recenti di Matplotlib. Innanzitutto, estrarremo i dati da GitHub.
import matplotlib.pyplot as plt
import numpy as np
import matplotlib.dates as mdates
from datetime import datetime

try:
    # Try to fetch a list of Matplotlib releases and their dates
    # from https://api.github.com/repos/matplotlib/matplotlib/releases
    import urllib.request
    import json

    url = 'https://api.github.com/repos/matplotlib/matplotlib/releases'
    url += '?per_page=100'
    data = json.loads(urllib.request.urlopen(url, timeout=.4).read().decode())

    dates = []
    names = []
    for item in data:
        if 'rc' not in item['tag_name'] and 'b' not in item['tag_name']:
            dates.append(item['published_at'].split("T")[0])
            names.append(item['tag_name'])
    # Convert date strings (e.g. 2014-10-18) to datetime
    dates = [datetime.strptime(d, "%Y-%m-%d") for d in dates]

except Exception:
    # In case the above fails, e.g. because of missing internet connection
    # use the following lists as fallback.
    names = ['v2.2.4', 'v3.0.3', 'v3.0.2', 'v3.0.1', 'v3.0.0', 'v2.2.3',
             'v2.2.2', 'v2.2.1', 'v2.2.0', 'v2.1.2', 'v2.1.1', 'v2.1.0',
             'v2.0.2', 'v2.0.1', 'v2.0.0', 'v1.5.3', 'v1.5.2', 'v1.5.1',
             'v1.5.0', 'v1.4.3', 'v1.4.2', 'v1.4.1', 'v1.4.0']

    dates = ['2019-02-26', '2019-02-26', '2018-11-10', '2018-11-10',
             '2018-09-18', '2018-08-10', '2018-03-17', '2018-03-16',
             '2018-03-06', '2018-01-18', '2017-12-10', '2017-10-07',
             '2017-05-10', '2017-05-02', '2017-01-17', '2016-09-09',
             '2016-07-03', '2016-01-10', '2015-10-29', '2015-02-16',
             '2014-10-26', '2014-10-18', '2014-08-26']

    # Convert date strings (e.g. 2014-10-18) to datetime
    dates = [datetime.strptime(d, "%Y-%m-%d") for d in dates]
Successivamente, creeremo uno stem plot con alcune variazioni nei livelli per distinguere anche gli eventi vicini. Aggiungiamo marcatori sulla linea di base per enfatizzare visivamente la natura unidimensionale della linea del tempo.
Per ogni evento, aggiungiamo un'etichetta di testo tramite annotate, che è spostata in unità di punti dalla punta della linea dell'evento.
Si noti che Matplotlib traccerà automaticamente gli input datetime.
# Choose some nice levels
levels = np.tile([-5, 5, -3, 3, -1, 1],
                 int(np.ceil(len(dates)/6)))[:len(dates)]

# Create figure and plot a stem plot with the date
fig, ax = plt.subplots(figsize=(8.8, 4), constrained_layout=True)
ax.set(title="Matplotlib release dates")

ax.vlines(dates, 0, levels, color="tab:red")  # The vertical stems.
ax.plot(dates, np.zeros_like(dates), "-o",
        color="k", markerfacecolor="w")  # Baseline and markers on it.

# annotate lines
for d, l, r in zip(dates, levels, names):
    ax.annotate(r, xy=(d, l),
                xytext=(-3, np.sign(l)*3), textcoords="offset points",
                horizontalalignment="right",
                verticalalignment="bottom" if l > 0 else "top")

# format xaxis with 4 month intervals
ax.xaxis.set_major_locator(mdates.MonthLocator(interval=4))
ax.xaxis.set_major_formatter(mdates.DateFormatter("%b %Y"))
plt.setp(ax.get_xticklabels(), rotation=30, ha="right")

# remove y axis and spines
ax.yaxis.set_visible(False)
ax.spines[["left", "top", "right"]].set_visible(False)

ax.margins(y=0.1)
plt.show()

Riferimenti
L'uso delle seguenti funzioni, metodi, classi e moduli è mostrato in questo esempio:
Tempo di esecuzione totale dello script: (0 minuti 1,168 secondi)