Nota
Fare clic qui per scaricare il codice di esempio completo
Creazione di mappe di calore annotate #
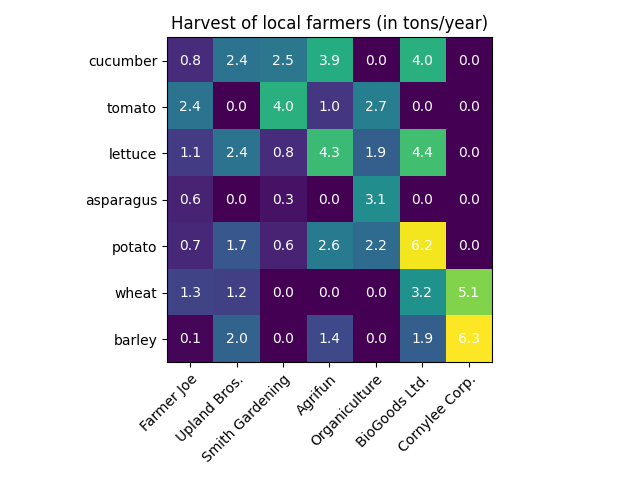
Spesso è desiderabile mostrare i dati che dipendono da due variabili indipendenti come un grafico dell'immagine con codice colore. Questo è spesso indicato come una mappa di calore. Se i dati sono categorici, si parla di heatmap categorica.
La funzione di Matplotlib imshowrende particolarmente facile la produzione di tali grafici.
Gli esempi seguenti mostrano come creare una mappa termica con annotazioni. Inizieremo con un semplice esempio e lo espanderemo per renderlo utilizzabile come funzione universale.
Una semplice heatmap categorica #
Possiamo iniziare definendo alcuni dati. Ciò di cui abbiamo bisogno è un elenco o un array 2D che definisca i dati in codice colore. Abbiamo quindi bisogno anche di due liste o array di categorie; ovviamente il numero di elementi in tali elenchi deve corrispondere ai dati lungo i rispettivi assi. La heatmap stessa è un imshowgrafico con le etichette impostate sulle categorie che abbiamo. Si noti che è importante impostare sia le posizioni dei tick ( set_xticks) che le etichette dei tick ( set_xticklabels), altrimenti non sarebbero più sincronizzate. Le posizioni sono solo i numeri interi ascendenti, mentre le ticklabel sono le etichette da mostrare. Infine possiamo etichettare i dati stessi creando un Text
all'interno di ogni cella che mostra il valore di quella cella.
import numpy as np
import matplotlib
import matplotlib as mpl
import matplotlib.pyplot as plt

vegetables = ["cucumber", "tomato", "lettuce", "asparagus",
              "potato", "wheat", "barley"]
farmers = ["Farmer Joe", "Upland Bros.", "Smith Gardening",
           "Agrifun", "Organiculture", "BioGoods Ltd.", "Cornylee Corp."]

harvest = np.array([[0.8, 2.4, 2.5, 3.9, 0.0, 4.0, 0.0],
                    [2.4, 0.0, 4.0, 1.0, 2.7, 0.0, 0.0],
                    [1.1, 2.4, 0.8, 4.3, 1.9, 4.4, 0.0],
                    [0.6, 0.0, 0.3, 0.0, 3.1, 0.0, 0.0],
                    [0.7, 1.7, 0.6, 2.6, 2.2, 6.2, 0.0],
                    [1.3, 1.2, 0.0, 0.0, 0.0, 3.2, 5.1],
                    [0.1, 2.0, 0.0, 1.4, 0.0, 1.9, 6.3]])


fig, ax = plt.subplots()
im = ax.imshow(harvest)

# Show all ticks and label them with the respective list entries
ax.set_xticks(np.arange(len(farmers)), labels=farmers)
ax.set_yticks(np.arange(len(vegetables)), labels=vegetables)

# Rotate the tick labels and set their alignment.
plt.setp(ax.get_xticklabels(), rotation=45, ha="right",
         rotation_mode="anchor")

# Loop over data dimensions and create text annotations.
for i in range(len(vegetables)):
    for j in range(len(farmers)):
        text = ax.text(j, i, harvest[i, j],
                       ha="center", va="center", color="w")

ax.set_title("Harvest of local farmers (in tons/year)")
fig.tight_layout()
plt.show()

Utilizzo dello stile del codice della funzione helper #
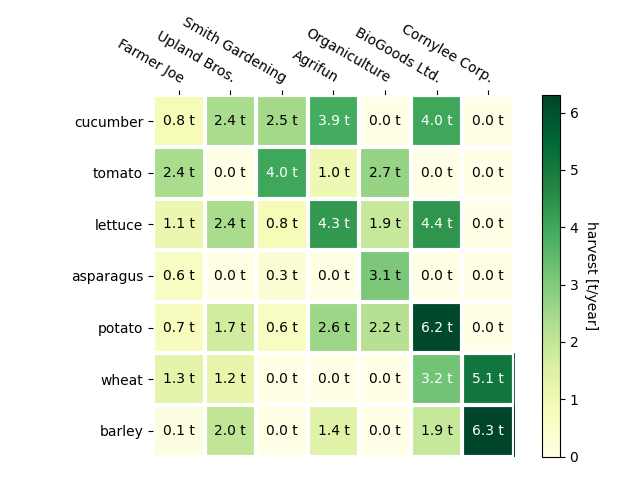
Come discusso negli stili di codifica, si potrebbe voler riutilizzare tale codice per creare una sorta di heatmap per dati di input diversi e/o su assi diversi. Creiamo una funzione che prende i dati e le etichette di riga e colonna come input e consente argomenti che vengono utilizzati per personalizzare il grafico
Qui, oltre a quanto sopra vogliamo anche creare una barra dei colori e posizionare le etichette sopra la heatmap invece che sotto di essa. Le annotazioni avranno colori diversi a seconda di una soglia per un migliore contrasto rispetto al colore dei pixel. Infine, disattiviamo le spine degli assi circostanti e creiamo una griglia di linee bianche per separare le celle.
def heatmap(data, row_labels, col_labels, ax=None,
            cbar_kw=None, cbarlabel="", **kwargs):
    """
    Create a heatmap from a numpy array and two lists of labels.

    Parameters
    ----------
    data
        A 2D numpy array of shape (M, N).
    row_labels
        A list or array of length M with the labels for the rows.
    col_labels
        A list or array of length N with the labels for the columns.
    ax
        A `matplotlib.axes.Axes` instance to which the heatmap is plotted.  If
        not provided, use current axes or create a new one.  Optional.
    cbar_kw
        A dictionary with arguments to `matplotlib.Figure.colorbar`.  Optional.
    cbarlabel
        The label for the colorbar.  Optional.
    **kwargs
        All other arguments are forwarded to `imshow`.
    """

    if ax is None:
        ax = plt.gca()

    if cbar_kw is None:
        cbar_kw = {}

    # Plot the heatmap
    im = ax.imshow(data, **kwargs)

    # Create colorbar
    cbar = ax.figure.colorbar(im, ax=ax, **cbar_kw)
    cbar.ax.set_ylabel(cbarlabel, rotation=-90, va="bottom")

    # Show all ticks and label them with the respective list entries.
    ax.set_xticks(np.arange(data.shape[1]), labels=col_labels)
    ax.set_yticks(np.arange(data.shape[0]), labels=row_labels)

    # Let the horizontal axes labeling appear on top.
    ax.tick_params(top=True, bottom=False,
                   labeltop=True, labelbottom=False)

    # Rotate the tick labels and set their alignment.
    plt.setp(ax.get_xticklabels(), rotation=-30, ha="right",
             rotation_mode="anchor")

    # Turn spines off and create white grid.
    ax.spines[:].set_visible(False)

    ax.set_xticks(np.arange(data.shape[1]+1)-.5, minor=True)
    ax.set_yticks(np.arange(data.shape[0]+1)-.5, minor=True)
    ax.grid(which="minor", color="w", linestyle='-', linewidth=3)
    ax.tick_params(which="minor", bottom=False, left=False)

    return im, cbar


def annotate_heatmap(im, data=None, valfmt="{x:.2f}",
                     textcolors=("black", "white"),
                     threshold=None, **textkw):
    """
    A function to annotate a heatmap.

    Parameters
    ----------
    im
        The AxesImage to be labeled.
    data
        Data used to annotate.  If None, the image's data is used.  Optional.
    valfmt
        The format of the annotations inside the heatmap.  This should either
        use the string format method, e.g. "$ {x:.2f}", or be a
        `matplotlib.ticker.Formatter`.  Optional.
    textcolors
        A pair of colors.  The first is used for values below a threshold,
        the second for those above.  Optional.
    threshold
        Value in data units according to which the colors from textcolors are
        applied.  If None (the default) uses the middle of the colormap as
        separation.  Optional.
    **kwargs
        All other arguments are forwarded to each call to `text` used to create
        the text labels.
    """

    if not isinstance(data, (list, np.ndarray)):
        data = im.get_array()

    # Normalize the threshold to the images color range.
    if threshold is not None:
        threshold = im.norm(threshold)
    else:
        threshold = im.norm(data.max())/2.

    # Set default alignment to center, but allow it to be
    # overwritten by textkw.
    kw = dict(horizontalalignment="center",
              verticalalignment="center")
    kw.update(textkw)

    # Get the formatter in case a string is supplied
    if isinstance(valfmt, str):
        valfmt = matplotlib.ticker.StrMethodFormatter(valfmt)

    # Loop over the data and create a `Text` for each "pixel".
    # Change the text's color depending on the data.
    texts = []
    for i in range(data.shape[0]):
        for j in range(data.shape[1]):
            kw.update(color=textcolors[int(im.norm(data[i, j]) > threshold)])
            text = im.axes.text(j, i, valfmt(data[i, j], None), **kw)
            texts.append(text)

    return texts
Quanto sopra ora ci consente di mantenere la creazione della trama effettiva piuttosto compatta.
fig, ax = plt.subplots()

im, cbar = heatmap(harvest, vegetables, farmers, ax=ax,
                   cmap="YlGn", cbarlabel="harvest [t/year]")
texts = annotate_heatmap(im, valfmt="{x:.1f} t")

fig.tight_layout()
plt.show()

Alcuni esempi di mappe di calore più complesse #
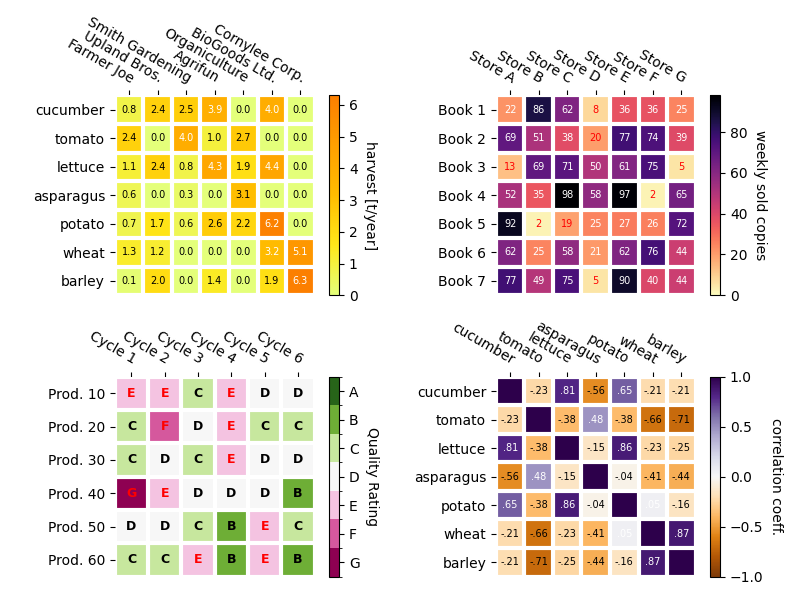
Di seguito mostriamo la versatilità delle funzioni create in precedenza applicandola in diversi casi e utilizzando diversi argomenti.
np.random.seed(19680801)

fig, ((ax, ax2), (ax3, ax4)) = plt.subplots(2, 2, figsize=(8, 6))

# Replicate the above example with a different font size and colormap.

im, _ = heatmap(harvest, vegetables, farmers, ax=ax,
                cmap="Wistia", cbarlabel="harvest [t/year]")
annotate_heatmap(im, valfmt="{x:.1f}", size=7)

# Create some new data, give further arguments to imshow (vmin),
# use an integer format on the annotations and provide some colors.

data = np.random.randint(2, 100, size=(7, 7))
y = ["Book {}".format(i) for i in range(1, 8)]
x = ["Store {}".format(i) for i in list("ABCDEFG")]
im, _ = heatmap(data, y, x, ax=ax2, vmin=0,
                cmap="magma_r", cbarlabel="weekly sold copies")
annotate_heatmap(im, valfmt="{x:d}", size=7, threshold=20,
                 textcolors=("red", "white"))

# Sometimes even the data itself is categorical. Here we use a
# `matplotlib.colors.BoundaryNorm` to get the data into classes
# and use this to colorize the plot, but also to obtain the class
# labels from an array of classes.

data = np.random.randn(6, 6)
y = ["Prod. {}".format(i) for i in range(10, 70, 10)]
x = ["Cycle {}".format(i) for i in range(1, 7)]

qrates = list("ABCDEFG")
norm = matplotlib.colors.BoundaryNorm(np.linspace(-3.5, 3.5, 8), 7)
fmt = matplotlib.ticker.FuncFormatter(lambda x, pos: qrates[::-1][norm(x)])

im, _ = heatmap(data, y, x, ax=ax3,
                cmap=mpl.colormaps["PiYG"].resampled(7), norm=norm,
                cbar_kw=dict(ticks=np.arange(-3, 4), format=fmt),
                cbarlabel="Quality Rating")

annotate_heatmap(im, valfmt=fmt, size=9, fontweight="bold", threshold=-1,
                 textcolors=("red", "black"))

# We can nicely plot a correlation matrix. Since this is bound by -1 and 1,
# we use those as vmin and vmax. We may also remove leading zeros and hide
# the diagonal elements (which are all 1) by using a
# `matplotlib.ticker.FuncFormatter`.

corr_matrix = np.corrcoef(harvest)
im, _ = heatmap(corr_matrix, vegetables, vegetables, ax=ax4,
                cmap="PuOr", vmin=-1, vmax=1,
                cbarlabel="correlation coeff.")


def func(x, pos):
    return "{:.2f}".format(x).replace("0.", ".").replace("1.00", "")

annotate_heatmap(im, valfmt=matplotlib.ticker.FuncFormatter(func), size=7)


plt.tight_layout()
plt.show()

Riferimenti
L'uso delle seguenti funzioni, metodi, classi e moduli è mostrato in questo esempio:
Tempo di esecuzione totale dello script: (0 minuti 2,652 secondi)