Nota
Fare clic qui per scaricare il codice di esempio completo
Annota Simple02 #
import matplotlib.pyplot as plt
fig, ax = plt.subplots(figsize=(3, 3))
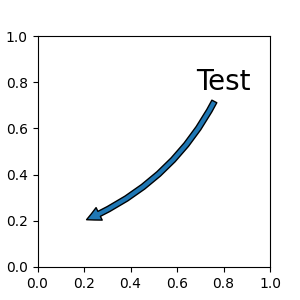
ax.annotate("Test",
xy=(0.2, 0.2), xycoords='data',
xytext=(0.8, 0.8), textcoords='data',
size=20, va="center", ha="center",
arrowprops=dict(arrowstyle="simple",
connectionstyle="arc3,rad=-0.2"),
)
plt.show()