Nota
Fare clic qui per scaricare il codice di esempio completo
TickedStroke patheffect #
Matplotlib patheffectspuò essere utilizzato per modificare il modo in cui i percorsi vengono tracciati a un livello sufficientemente basso da poter influenzare quasi tutto.
La guida sugli effetti di percorso descrive in dettaglio l'uso degli effetti di percorso.
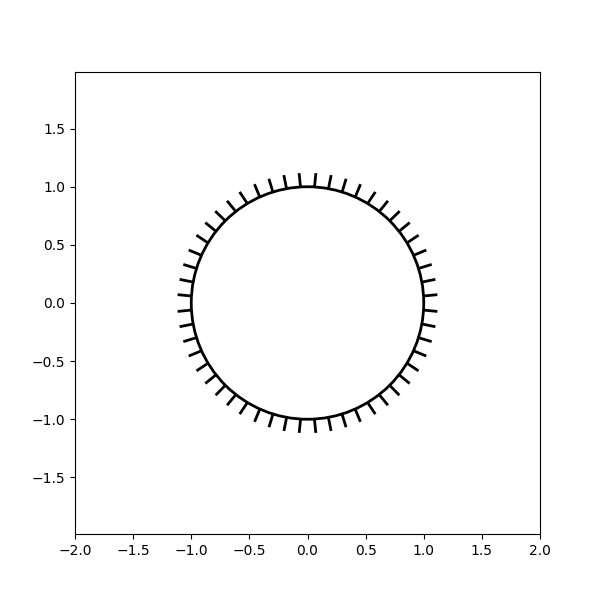
Il TickedStrokepatheffect qui illustrato disegna un tracciato con uno stile spuntato. È possibile controllare la spaziatura, la lunghezza e l'angolo delle zecche.
Vedere anche l' esempio dimostrativo del contorno .
Vedere anche i contorni nell'esempio di ottimizzazione .
Applicazione di TickedStroke ai tracciati #
import matplotlib.patches as patches
from matplotlib.path import Path
import numpy as np
import matplotlib.pyplot as plt
import matplotlib.patheffects as patheffects

fig, ax = plt.subplots(figsize=(6, 6))
path = Path.unit_circle()
patch = patches.PathPatch(path, facecolor='none', lw=2, path_effects=[
    patheffects.withTickedStroke(angle=-90, spacing=10, length=1)])

ax.add_patch(patch)
ax.axis('equal')
ax.set_xlim(-2, 2)
ax.set_ylim(-2, 2)

plt.show()

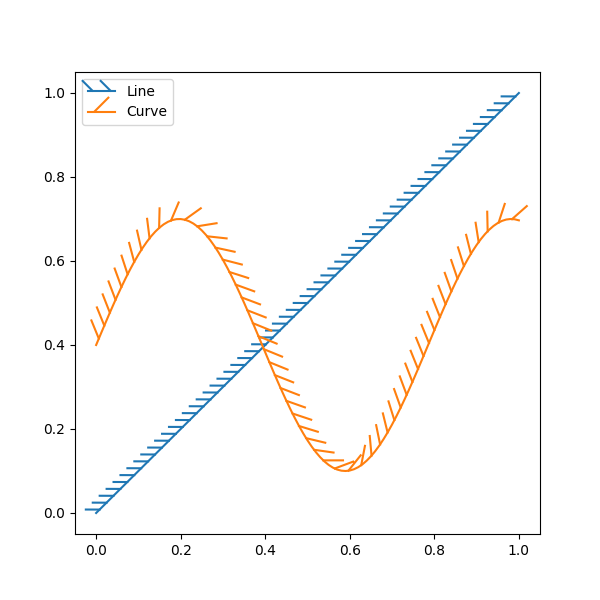
Applicazione di TickedStroke alle linee #
fig, ax = plt.subplots(figsize=(6, 6))
ax.plot([0, 1], [0, 1], label="Line",
        path_effects=[patheffects.withTickedStroke(spacing=7, angle=135)])

nx = 101
x = np.linspace(0.0, 1.0, nx)
y = 0.3*np.sin(x*8) + 0.4
ax.plot(x, y, label="Curve", path_effects=[patheffects.withTickedStroke()])

ax.legend()

plt.show()

Applicazione di TickedStroke ai grafici di contorno #
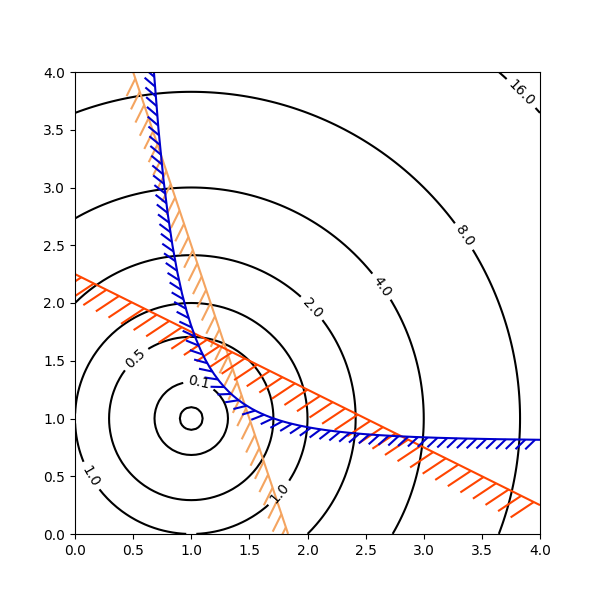
Grafico di contorno con obiettivo e vincoli. Le curve generate dal contorno per rappresentare un vincolo tipico in un problema di ottimizzazione dovrebbero essere tracciate con angoli compresi tra zero e 180 gradi.
fig, ax = plt.subplots(figsize=(6, 6))

nx = 101
ny = 105

# Set up survey vectors
xvec = np.linspace(0.001, 4.0, nx)
yvec = np.linspace(0.001, 4.0, ny)

# Set up survey matrices.  Design disk loading and gear ratio.
x1, x2 = np.meshgrid(xvec, yvec)

# Evaluate some stuff to plot
obj = x1**2 + x2**2 - 2*x1 - 2*x2 + 2
g1 = -(3*x1 + x2 - 5.5)
g2 = -(x1 + 2*x2 - 4.5)
g3 = 0.8 + x1**-3 - x2

cntr = ax.contour(x1, x2, obj, [0.01, 0.1, 0.5, 1, 2, 4, 8, 16],
                  colors='black')
ax.clabel(cntr, fmt="%2.1f", use_clabeltext=True)

cg1 = ax.contour(x1, x2, g1, [0], colors='sandybrown')
plt.setp(cg1.collections,
         path_effects=[patheffects.withTickedStroke(angle=135)])

cg2 = ax.contour(x1, x2, g2, [0], colors='orangered')
plt.setp(cg2.collections,
         path_effects=[patheffects.withTickedStroke(angle=60, length=2)])

cg3 = ax.contour(x1, x2, g3, [0], colors='mediumblue')
plt.setp(cg3.collections,
         path_effects=[patheffects.withTickedStroke(spacing=7)])

ax.set_xlim(0, 4)
ax.set_ylim(0, 4)

plt.show()

Tempo di esecuzione totale dello script: (0 minuti 1,492 secondi)