Nota
Fare clic qui per scaricare il codice di esempio completo
Sottocampionamento barra di errore #
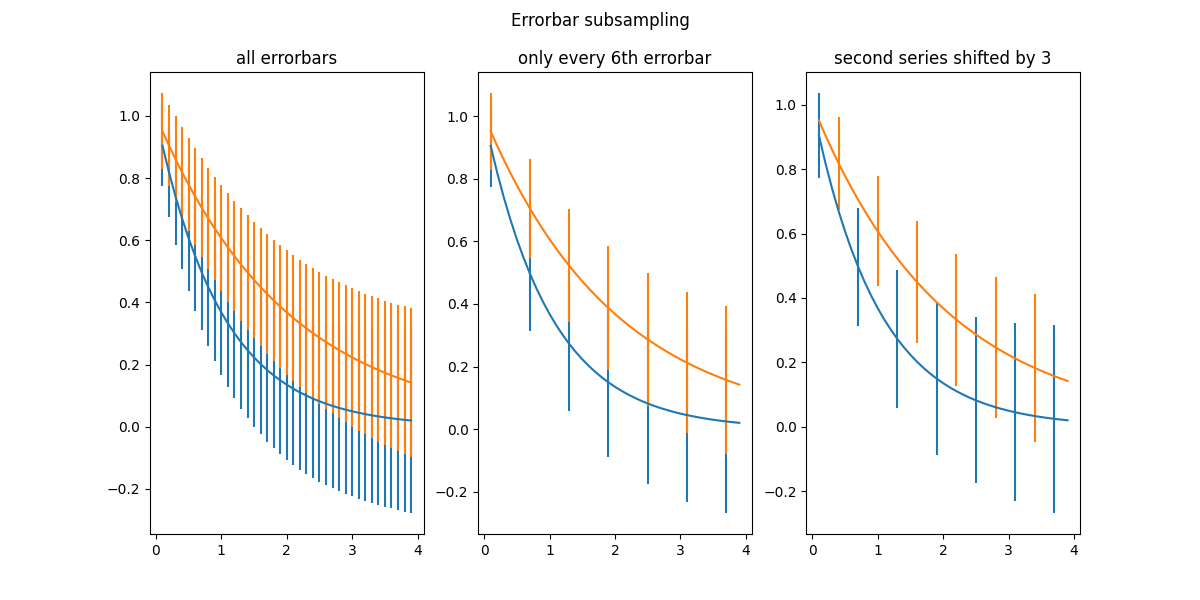
Il parametro errorevery of Axes.errorbarpuò essere utilizzato per disegnare barre di errore solo su un sottoinsieme di punti dati. Ciò è particolarmente utile se sono presenti molti punti dati con errori simili.

import numpy as np
import matplotlib.pyplot as plt

# example data
x = np.arange(0.1, 4, 0.1)
y1 = np.exp(-1.0 * x)
y2 = np.exp(-0.5 * x)

# example variable error bar values
y1err = 0.1 + 0.1 * np.sqrt(x)
y2err = 0.1 + 0.1 * np.sqrt(x/2)


fig, (ax0, ax1, ax2) = plt.subplots(nrows=1, ncols=3, sharex=True,
                                    figsize=(12, 6))

ax0.set_title('all errorbars')
ax0.errorbar(x, y1, yerr=y1err)
ax0.errorbar(x, y2, yerr=y2err)

ax1.set_title('only every 6th errorbar')
ax1.errorbar(x, y1, yerr=y1err, errorevery=6)
ax1.errorbar(x, y2, yerr=y2err, errorevery=6)

ax2.set_title('second series shifted by 3')
ax2.errorbar(x, y1, yerr=y1err, errorevery=(0, 6))
ax2.errorbar(x, y2, yerr=y2err, errorevery=(3, 6))

fig.suptitle('Errorbar subsampling')
plt.show()