Nota
Fare clic qui per scaricare il codice di esempio completo
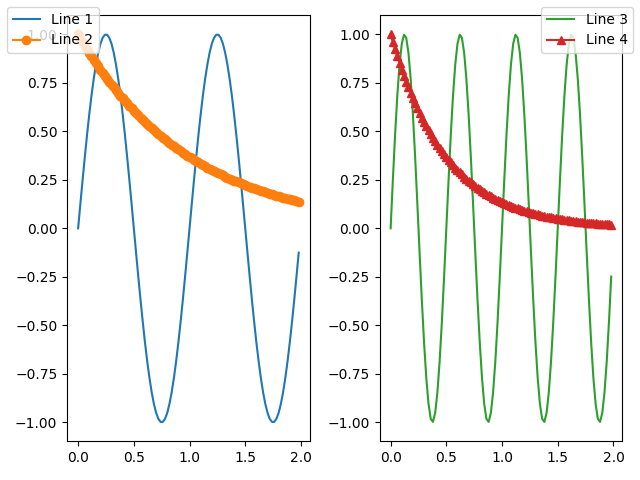
Dimostrazione della legenda della figura #
Invece di tracciare una legenda su ciascun asse, è possibile tracciare una legenda per tutti gli artisti su tutti i sottoassi di una figura.

import numpy as np
import matplotlib.pyplot as plt

fig, axs = plt.subplots(1, 2)

x = np.arange(0.0, 2.0, 0.02)
y1 = np.sin(2 * np.pi * x)
y2 = np.exp(-x)
l1, = axs[0].plot(x, y1)
l2, = axs[0].plot(x, y2, marker='o')

y3 = np.sin(4 * np.pi * x)
y4 = np.exp(-2 * x)
l3, = axs[1].plot(x, y3, color='tab:green')
l4, = axs[1].plot(x, y4, color='tab:red', marker='^')

fig.legend((l1, l2), ('Line 1', 'Line 2'), loc='upper left')
fig.legend((l3, l4), ('Line 3', 'Line 4'), loc='upper right')

plt.tight_layout()
plt.show()