Nota
Fare clic qui per scaricare il codice di esempio completo
Barra demo con unità #
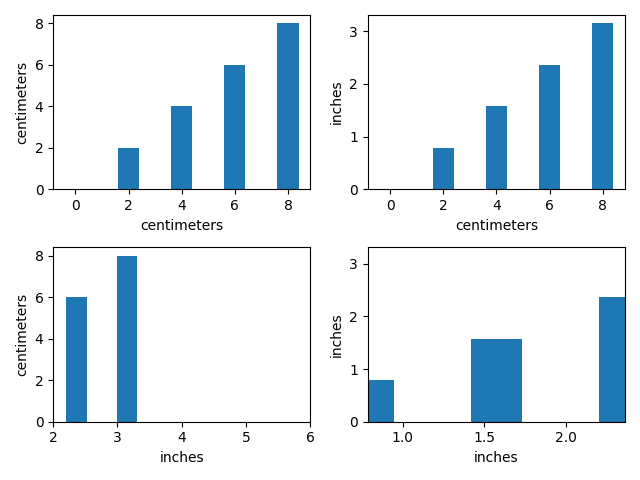
Un grafico che utilizza una varietà di conversioni in centimetri e pollici. Questo esempio mostra come funziona l'introspezione delle unità predefinite (ax1), come si possono usare varie parole chiave per impostare le unità x e y per sovrascrivere le impostazioni predefinite (ax2, ax3, ax4) e come si possono impostare gli xlimits usando scalari (ax3, unità correnti assunto) o unità (conversioni applicate per ottenere i numeri in unità correnti).
Questo esempio richiedebasic_units.py

import numpy as np
from basic_units import cm, inch
import matplotlib.pyplot as plt

cms = cm * np.arange(0, 10, 2)
bottom = 0 * cm
width = 0.8 * cm

fig, axs = plt.subplots(2, 2)

axs[0, 0].bar(cms, cms, bottom=bottom)

axs[0, 1].bar(cms, cms, bottom=bottom, width=width, xunits=cm, yunits=inch)

axs[1, 0].bar(cms, cms, bottom=bottom, width=width, xunits=inch, yunits=cm)
axs[1, 0].set_xlim(2, 6)  # scalars are interpreted in current units

axs[1, 1].bar(cms, cms, bottom=bottom, width=width, xunits=inch, yunits=inch)
axs[1, 1].set_xlim(2 * cm, 6 * cm)  # cm are converted to inches

fig.tight_layout()
plt.show()