Nota
Fare clic qui per scaricare il codice di esempio completo
Curva con banda di errore #
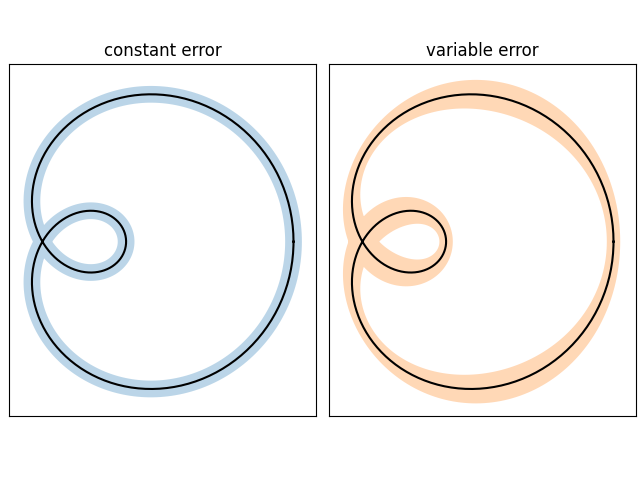
Questo esempio illustra come disegnare una banda di errore attorno a una curva parametrizzata.
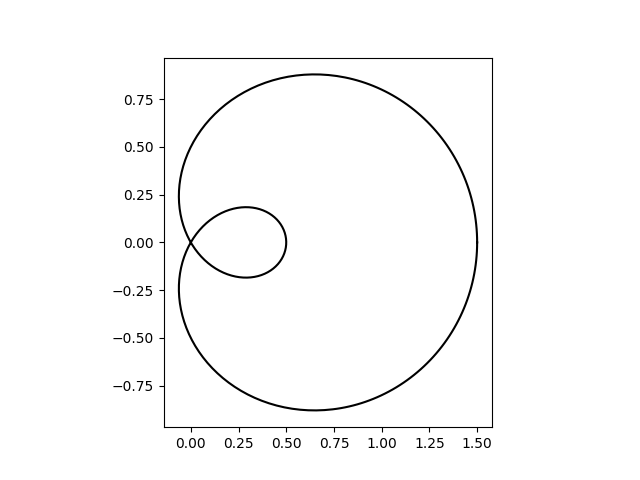
Una curva parametrizzata x(t), y(t) può essere disegnata direttamente usando plot.

[None]
Una banda di errore può essere utilizzata per indicare l'incertezza della curva. In questo esempio assumiamo che l'errore possa essere dato come uno scalare err che descrive l'incertezza perpendicolare alla curva in ogni punto.
Visualizziamo questo errore come una banda colorata attorno al percorso utilizzando un'estensione
PathPatch. La patch viene creata da due segmenti di percorso (xp, yp) e
(xn, yn) che vengono spostati di +/- err perpendicolarmente alla curva (x, y) .
Nota: questo metodo di utilizzo di a PathPatchè adatto a curve arbitrarie in 2D. Se hai solo un grafico standard y-vs.-x, puoi usare il
fill_betweenmetodo più semplice (vedi anche
Riempire l'area tra le linee ).
def draw_error_band(ax, x, y, err, **kwargs):
    # Calculate normals via centered finite differences (except the first point
    # which uses a forward difference and the last point which uses a backward
    # difference).
    dx = np.concatenate([[x[1] - x[0]], x[2:] - x[:-2], [x[-1] - x[-2]]])
    dy = np.concatenate([[y[1] - y[0]], y[2:] - y[:-2], [y[-1] - y[-2]]])
    l = np.hypot(dx, dy)
    nx = dy / l
    ny = -dx / l

    # end points of errors
    xp = x + nx * err
    yp = y + ny * err
    xn = x - nx * err
    yn = y - ny * err

    vertices = np.block([[xp, xn[::-1]],
                         [yp, yn[::-1]]]).T
    codes = np.full(len(vertices), Path.LINETO)
    codes[0] = codes[len(xp)] = Path.MOVETO
    path = Path(vertices, codes)
    ax.add_patch(PathPatch(path, **kwargs))


axs = (plt.figure(constrained_layout=True)
       .subplots(1, 2, sharex=True, sharey=True))
errs = [
    (axs[0], "constant error", 0.05),
    (axs[1], "variable error", 0.05 * np.sin(2 * t) ** 2 + 0.04),
]
for i, (ax, title, err) in enumerate(errs):
    ax.set(title=title, aspect=1, xticks=[], yticks=[])
    ax.plot(x, y, "k")
    draw_error_band(ax, x, y, err=err,
                    facecolor=f"C{i}", edgecolor="none", alpha=.3)

plt.show()

Riferimenti
L'uso delle seguenti funzioni, metodi, classi e moduli è mostrato in questo esempio: