Nota
Fare clic qui per scaricare il codice di esempio completo
Distribuzione discreta come grafico a barre orizzontali #
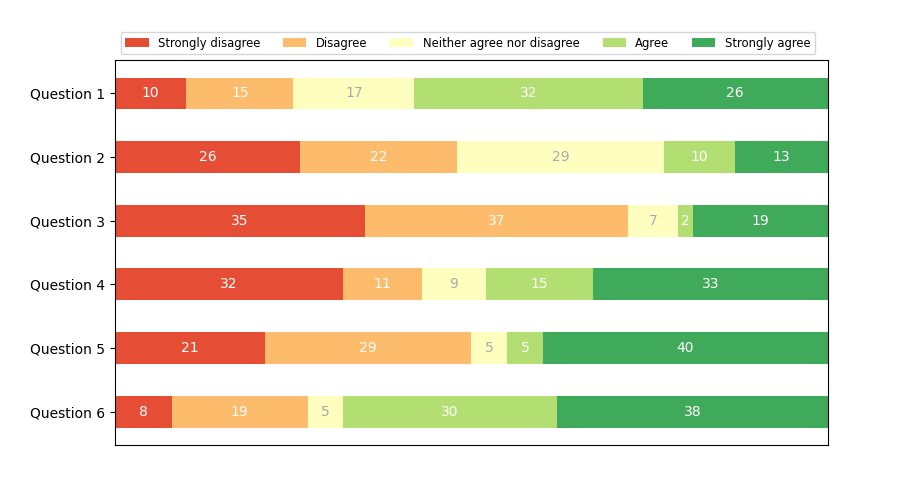
I grafici a barre in pila possono essere utilizzati per visualizzare distribuzioni discrete.
Questo esempio visualizza il risultato di un sondaggio in cui le persone potrebbero valutare il proprio consenso alle domande su una scala di cinque elementi.
Lo stacking orizzontale si ottiene richiamando barh()ogni categoria e passando il punto di partenza come somma cumulativa delle barre già disegnate tramite il parametro left.
import numpy as np
import matplotlib.pyplot as plt


category_names = ['Strongly disagree', 'Disagree',
                  'Neither agree nor disagree', 'Agree', 'Strongly agree']
results = {
    'Question 1': [10, 15, 17, 32, 26],
    'Question 2': [26, 22, 29, 10, 13],
    'Question 3': [35, 37, 7, 2, 19],
    'Question 4': [32, 11, 9, 15, 33],
    'Question 5': [21, 29, 5, 5, 40],
    'Question 6': [8, 19, 5, 30, 38]
}


def survey(results, category_names):
    """
    Parameters
    ----------
    results : dict
        A mapping from question labels to a list of answers per category.
        It is assumed all lists contain the same number of entries and that
        it matches the length of *category_names*.
    category_names : list of str
        The category labels.
    """
    labels = list(results.keys())
    data = np.array(list(results.values()))
    data_cum = data.cumsum(axis=1)
    category_colors = plt.colormaps['RdYlGn'](
        np.linspace(0.15, 0.85, data.shape[1]))

    fig, ax = plt.subplots(figsize=(9.2, 5))
    ax.invert_yaxis()
    ax.xaxis.set_visible(False)
    ax.set_xlim(0, np.sum(data, axis=1).max())

    for i, (colname, color) in enumerate(zip(category_names, category_colors)):
        widths = data[:, i]
        starts = data_cum[:, i] - widths
        rects = ax.barh(labels, widths, left=starts, height=0.5,
                        label=colname, color=color)

        r, g, b, _ = color
        text_color = 'white' if r * g * b < 0.5 else 'darkgrey'
        ax.bar_label(rects, label_type='center', color=text_color)
    ax.legend(ncol=len(category_names), bbox_to_anchor=(0, 1),
              loc='lower left', fontsize='small')

    return fig, ax


survey(results, category_names)
plt.show()

Riferimenti
L'uso delle seguenti funzioni, metodi, classi e moduli è mostrato in questo esempio: