Nota
Fare clic qui per scaricare il codice di esempio completo
Rapporto sulle coordinate n .
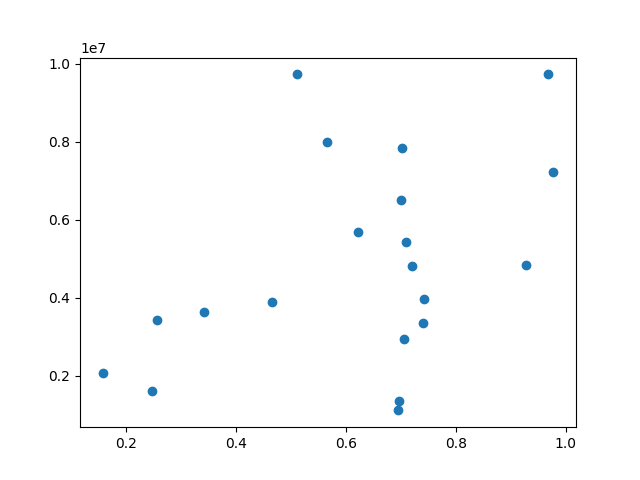
Sostituisci la segnalazione predefinita delle coordinate mentre il mouse si sposta sugli assi in un backend interattivo.

import matplotlib.pyplot as plt
import numpy as np


def millions(x):
    return '$%1.1fM' % (x * 1e-6)


# Fixing random state for reproducibility
np.random.seed(19680801)

x = np.random.rand(20)
y = 1e7 * np.random.rand(20)

fig, ax = plt.subplots()
ax.fmt_ydata = millions
plt.plot(x, y, 'o')

plt.show()