Nota
Fare clic qui per scaricare il codice di esempio completo
pcolormesh #
axes.Axes.pcolormeshconsente di generare grafici in stile immagine 2D. Nota che è più veloce del simile pcolor.
import matplotlib.pyplot as plt
from matplotlib.colors import BoundaryNorm
from matplotlib.ticker import MaxNLocator
import numpy as np
Pcolormesh di base #
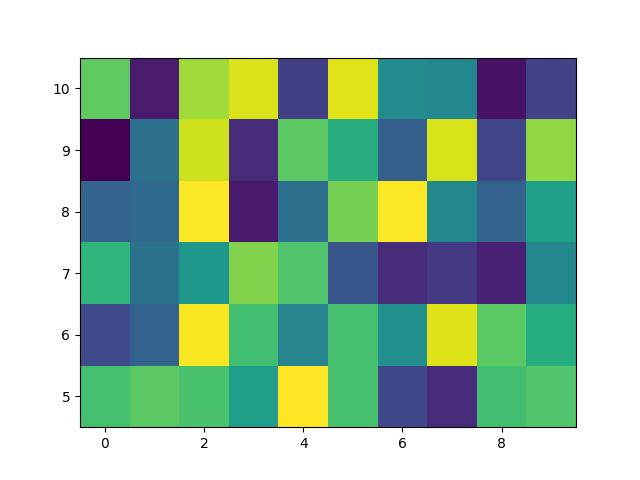
Di solito specifichiamo un pcolormesh definendo il bordo dei quadrilateri e il valore del quadrilatero. Si noti che qui x e y hanno ciascuno un elemento in più rispetto a Z nella rispettiva dimensione.
np.random.seed(19680801)
Z = np.random.rand(6, 10)
x = np.arange(-0.5, 10, 1)  # len = 11
y = np.arange(4.5, 11, 1)  # len = 7

fig, ax = plt.subplots()
ax.pcolormesh(x, y, Z)

<matplotlib.collections.QuadMesh object at 0x7f2d00aaeef0>
pcolormesh non rettilineo #
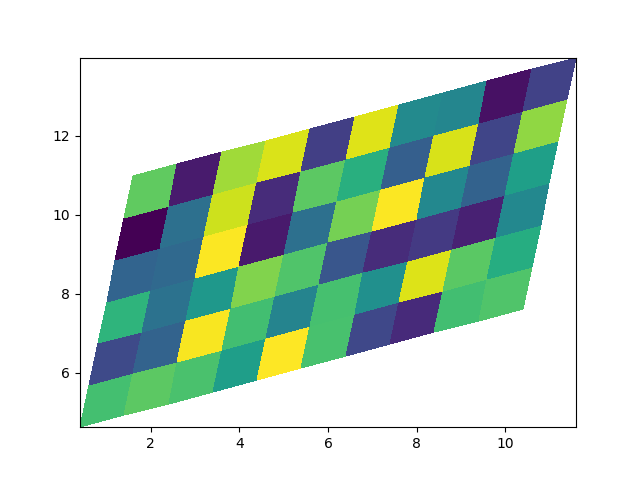
Si noti che possiamo anche specificare matrici per X e Y e avere quadrilateri non rettilinei.

<matplotlib.collections.QuadMesh object at 0x7f2d00c610f0>
Coordinate centrate #
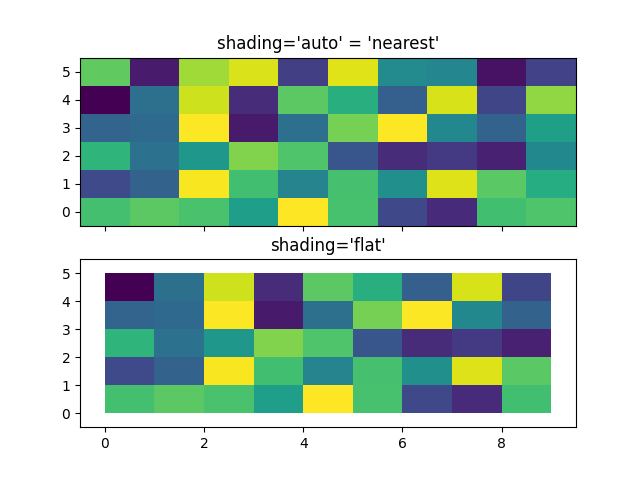
Spesso un utente vuole passare X e Y con le stesse dimensioni di Z a
axes.Axes.pcolormesh. Questo è consentito anche se shading='auto'viene passato (predefinito impostato da rcParams["pcolor.shading"](default: 'auto')). Pre Matplotlib 3.3, eliminerebbe
shading='flat'l'ultima colonna e riga di Z ; mentre ciò è ancora consentito per motivi di retrocompatibilità, viene generato un avviso di deprecazione. Se questo è davvero quello che vuoi, rilascia semplicemente l'ultima riga e colonna di Z manualmente:
x = np.arange(10)  # len = 10
y = np.arange(6)  # len = 6
X, Y = np.meshgrid(x, y)

fig, axs = plt.subplots(2, 1, sharex=True, sharey=True)
axs[0].pcolormesh(X, Y, Z, vmin=np.min(Z), vmax=np.max(Z), shading='auto')
axs[0].set_title("shading='auto' = 'nearest'")
axs[1].pcolormesh(X, Y, Z[:-1, :-1], vmin=np.min(Z), vmax=np.max(Z),
                  shading='flat')
axs[1].set_title("shading='flat'")

Text(0.5, 1.0, "shading='flat'")
Fare livelli usando le Norme #
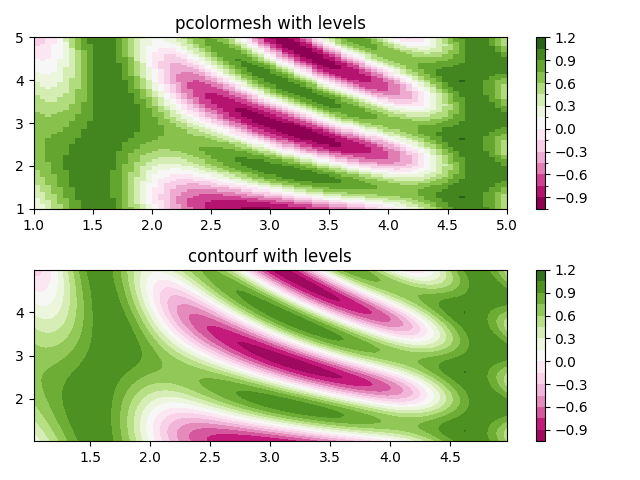
Mostra come combinare le istanze Normalization e Colormap per disegnare "livelli" in axes.Axes.pcolore axes.Axes.pcolormesh
digitare axes.Axes.imshowi grafici in modo simile all'argomento della parola chiave levels per contour/contourf.
# make these smaller to increase the resolution
dx, dy = 0.05, 0.05

# generate 2 2d grids for the x & y bounds
y, x = np.mgrid[slice(1, 5 + dy, dy),
                slice(1, 5 + dx, dx)]

z = np.sin(x)**10 + np.cos(10 + y*x) * np.cos(x)

# x and y are bounds, so z should be the value *inside* those bounds.
# Therefore, remove the last value from the z array.
z = z[:-1, :-1]
levels = MaxNLocator(nbins=15).tick_values(z.min(), z.max())


# pick the desired colormap, sensible levels, and define a normalization
# instance which takes data values and translates those into levels.
cmap = plt.colormaps['PiYG']
norm = BoundaryNorm(levels, ncolors=cmap.N, clip=True)

fig, (ax0, ax1) = plt.subplots(nrows=2)

im = ax0.pcolormesh(x, y, z, cmap=cmap, norm=norm)
fig.colorbar(im, ax=ax0)
ax0.set_title('pcolormesh with levels')


# contours are *point* based plots, so convert our bound into point
# centers
cf = ax1.contourf(x[:-1, :-1] + dx/2.,
                  y[:-1, :-1] + dy/2., z, levels=levels,
                  cmap=cmap)
fig.colorbar(cf, ax=ax1)
ax1.set_title('contourf with levels')

# adjust spacing between subplots so `ax1` title and `ax0` tick labels
# don't overlap
fig.tight_layout()

plt.show()

Riferimenti
L'uso delle seguenti funzioni, metodi, classi e moduli è mostrato in questo esempio:
Tempo di esecuzione totale dello script: (0 minuti 1,467 secondi)