Nota
Fare clic qui per scaricare il codice di esempio completo
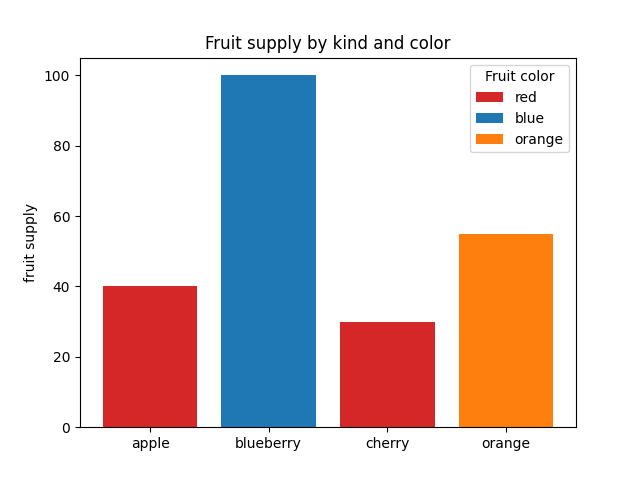
Demo del colore della barra #
Questo è un esempio che mostra come controllare il colore della barra e le voci della legenda utilizzando i parametri del colore e dell'etichettabar di . Tieni presente che le etichette con un carattere di sottolineatura precedente non verranno visualizzate nella legenda.
import matplotlib.pyplot as plt

fig, ax = plt.subplots()

fruits = ['apple', 'blueberry', 'cherry', 'orange']
counts = [40, 100, 30, 55]
bar_labels = ['red', 'blue', '_red', 'orange']
bar_colors = ['tab:red', 'tab:blue', 'tab:red', 'tab:orange']

ax.bar(fruits, counts, label=bar_labels, color=bar_colors)

ax.set_ylabel('fruit supply')
ax.set_title('Fruit supply by kind and color')
ax.legend(title='Fruit color')

plt.show()