Nota
Fare clic qui per scaricare il codice di esempio completo
Test di riferimento Usetex n.
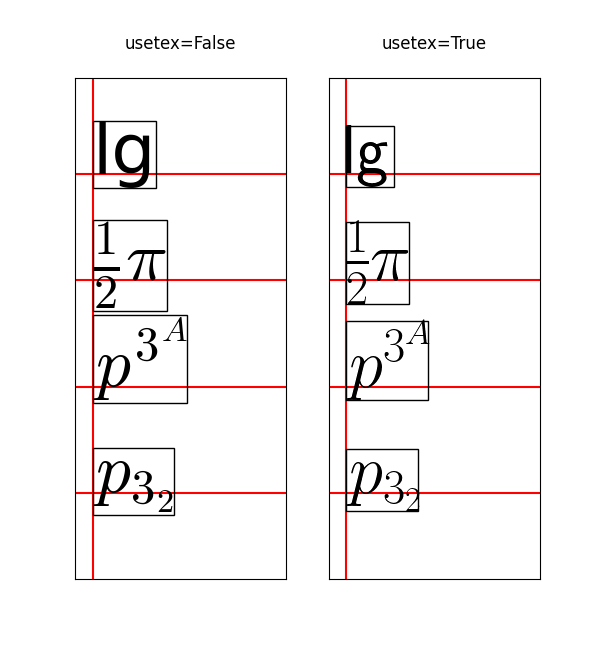
Confronto delle linee di base del testo calcolate per mathtext e usetex.

import matplotlib.pyplot as plt


plt.rcParams.update({"mathtext.fontset": "cm", "mathtext.rm": "serif"})
axs = plt.figure(figsize=(2 * 3, 6.5)).subplots(1, 2)
for ax, usetex in zip(axs, [False, True]):
    ax.axvline(0, color="r")
    test_strings = ["lg", r"$\frac{1}{2}\pi$", r"$p^{3^A}$", r"$p_{3_2}$"]
    for i, s in enumerate(test_strings):
        ax.axhline(i, color="r")
        ax.text(0., 3 - i, s,
                usetex=usetex,
                verticalalignment="baseline",
                size=50,
                bbox=dict(pad=0, ec="k", fc="none"))
    ax.set(xlim=(-0.1, 1.1), ylim=(-.8, 3.9), xticks=[], yticks=[],
           title=f"usetex={usetex}\n")
plt.show()