Nota
Fare clic qui per scaricare il codice di esempio completo
Leggenda polare n.
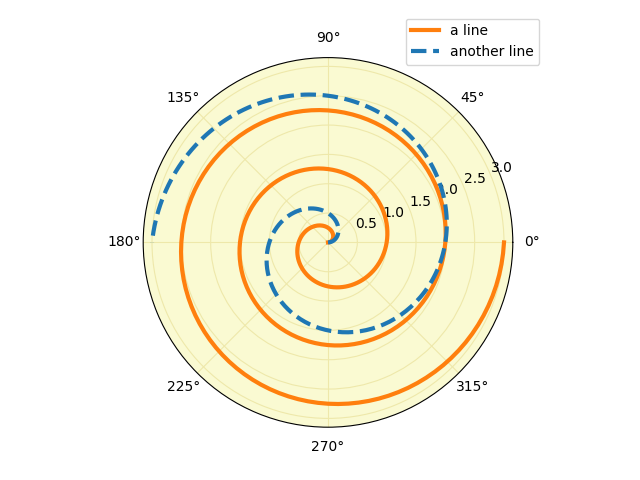
Demo di una legenda su un grafico dell'asse polare.
import matplotlib.pyplot as plt
import numpy as np

fig = plt.figure()
ax = fig.add_subplot(projection="polar", facecolor="lightgoldenrodyellow")

r = np.linspace(0, 3, 301)
theta = 2 * np.pi * r
ax.plot(theta, r, color="tab:orange", lw=3, label="a line")
ax.plot(0.5 * theta, r, color="tab:blue", ls="--", lw=3, label="another line")
ax.tick_params(grid_color="palegoldenrod")
# For polar axes, it may be useful to move the legend slightly away from the
# axes center, to avoid overlap between the legend and the axes.  The following
# snippet places the legend's lower left corner just outside of the polar axes
# at an angle of 67.5 degrees in polar coordinates.
angle = np.deg2rad(67.5)
ax.legend(loc="lower left",
          bbox_to_anchor=(.5 + np.cos(angle)/2, .5 + np.sin(angle)/2))

plt.show()

Riferimenti
L'uso delle seguenti funzioni, metodi, classi e moduli è mostrato in questo esempio: