Nota
Fare clic qui per scaricare il codice di esempio completo
Demo Pcolor #
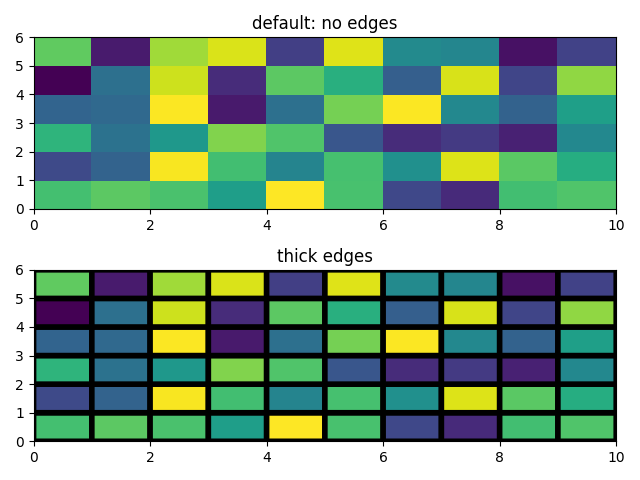
Generazione di immagini con pcolor.
Pcolor consente di generare grafici in stile immagine 2D. Di seguito mostreremo come farlo in Matplotlib.
import matplotlib.pyplot as plt
import numpy as np
from matplotlib.colors import LogNorm


# Fixing random state for reproducibility
np.random.seed(19680801)
Una semplice demo di pcolor #
Z = np.random.rand(6, 10)

fig, (ax0, ax1) = plt.subplots(2, 1)

c = ax0.pcolor(Z)
ax0.set_title('default: no edges')

c = ax1.pcolor(Z, edgecolors='k', linewidths=4)
ax1.set_title('thick edges')

fig.tight_layout()
plt.show()

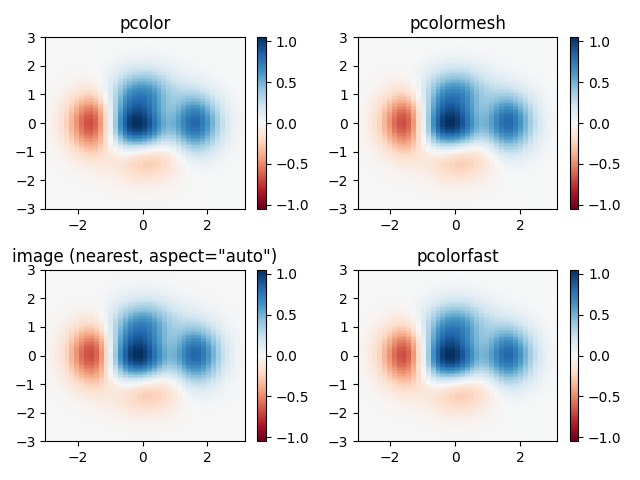
Confronto di pcolor con funzioni simili #
Dimostra somiglianze tra pcolor,
pcolormesh, imshowe
pcolorfastper disegnare griglie quadrilatere. Si noti che chiamiamo imshowcon aspect="auto"in modo che non imponga ai pixel di dati di essere quadrati (il valore predefinito è aspect="equal").
# make these smaller to increase the resolution
dx, dy = 0.15, 0.05

# generate 2 2d grids for the x & y bounds
y, x = np.mgrid[-3:3+dy:dy, -3:3+dx:dx]
z = (1 - x/2 + x**5 + y**3) * np.exp(-x**2 - y**2)
# x and y are bounds, so z should be the value *inside* those bounds.
# Therefore, remove the last value from the z array.
z = z[:-1, :-1]
z_min, z_max = -abs(z).max(), abs(z).max()

fig, axs = plt.subplots(2, 2)

ax = axs[0, 0]
c = ax.pcolor(x, y, z, cmap='RdBu', vmin=z_min, vmax=z_max)
ax.set_title('pcolor')
fig.colorbar(c, ax=ax)

ax = axs[0, 1]
c = ax.pcolormesh(x, y, z, cmap='RdBu', vmin=z_min, vmax=z_max)
ax.set_title('pcolormesh')
fig.colorbar(c, ax=ax)

ax = axs[1, 0]
c = ax.imshow(z, cmap='RdBu', vmin=z_min, vmax=z_max,
              extent=[x.min(), x.max(), y.min(), y.max()],
              interpolation='nearest', origin='lower', aspect='auto')
ax.set_title('image (nearest, aspect="auto")')
fig.colorbar(c, ax=ax)

ax = axs[1, 1]
c = ax.pcolorfast(x, y, z, cmap='RdBu', vmin=z_min, vmax=z_max)
ax.set_title('pcolorfast')
fig.colorbar(c, ax=ax)

fig.tight_layout()
plt.show()

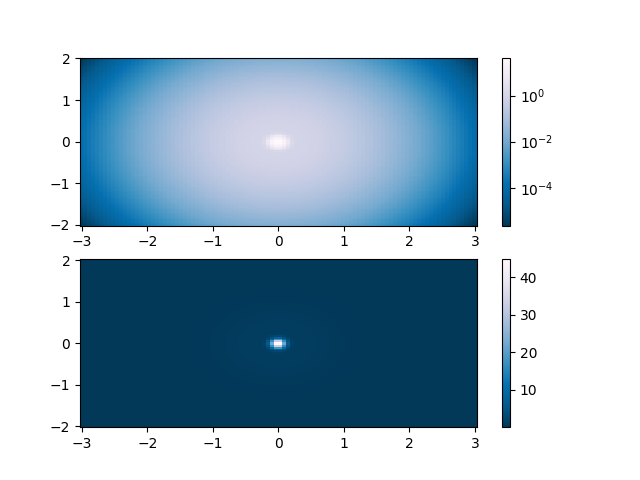
Pcolor con una scala logaritmica #
Quanto segue mostra i grafici pcolor con una scala logaritmica.
N = 100
X, Y = np.meshgrid(np.linspace(-3, 3, N), np.linspace(-2, 2, N))

# A low hump with a spike coming out.
# Needs to have z/colour axis on a log scale so we see both hump and spike.
# linear scale only shows the spike.
Z1 = np.exp(-X**2 - Y**2)
Z2 = np.exp(-(X * 10)**2 - (Y * 10)**2)
Z = Z1 + 50 * Z2

fig, (ax0, ax1) = plt.subplots(2, 1)

c = ax0.pcolor(X, Y, Z, shading='auto',
               norm=LogNorm(vmin=Z.min(), vmax=Z.max()), cmap='PuBu_r')
fig.colorbar(c, ax=ax0)

c = ax1.pcolor(X, Y, Z, cmap='PuBu_r', shading='auto')
fig.colorbar(c, ax=ax1)

plt.show()

Riferimenti
L'uso delle seguenti funzioni, metodi, classi e moduli è mostrato in questo esempio:
Tempo di esecuzione totale dello script: (0 minuti 1,891 secondi)