Nota
Fare clic qui per scaricare il codice di esempio completo
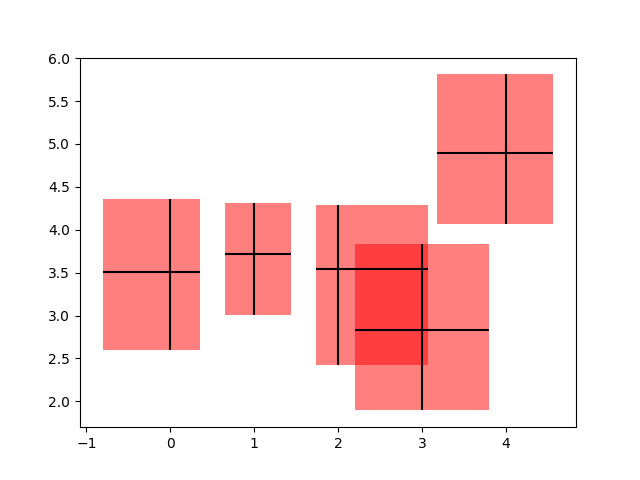
Creazione di caselle dalle barre di errore utilizzando PatchCollection #
In questo esempio, creiamo un grafico a barre di errore piuttosto standard aggiungendo una patch rettangolare definita dai limiti delle barre in entrambe le direzioni x e y. Per fare ciò, dobbiamo scrivere la nostra funzione personalizzata chiamata make_error_boxes. Un attento esame di questa funzione rivelerà il modello preferito nelle funzioni di scrittura per matplotlib:
un
Axesoggetto viene passato direttamente alla funzionela funzione opera sui
Axesmetodi direttamente, non attraverso l'pyplotinterfacciatracciare gli argomenti delle parole chiave che potrebbero essere abbreviati sono esplicitati per una migliore leggibilità del codice in futuro (ad esempio usiamo facecolor invece di fc )
gli artisti restituiti dai
Axesmetodi di plottaggio vengono quindi restituiti dalla funzione in modo che, se lo si desidera, i loro stili possano essere modificati successivamente al di fuori della funzione (non vengono modificati in questo esempio).
import numpy as np
import matplotlib.pyplot as plt
from matplotlib.collections import PatchCollection
from matplotlib.patches import Rectangle

# Number of data points
n = 5

# Dummy data
np.random.seed(19680801)
x = np.arange(0, n, 1)
y = np.random.rand(n) * 5.

# Dummy errors (above and below)
xerr = np.random.rand(2, n) + 0.1
yerr = np.random.rand(2, n) + 0.2


def make_error_boxes(ax, xdata, ydata, xerror, yerror, facecolor='r',
                     edgecolor='none', alpha=0.5):

    # Loop over data points; create box from errors at each point
    errorboxes = [Rectangle((x - xe[0], y - ye[0]), xe.sum(), ye.sum())
                  for x, y, xe, ye in zip(xdata, ydata, xerror.T, yerror.T)]

    # Create patch collection with specified colour/alpha
    pc = PatchCollection(errorboxes, facecolor=facecolor, alpha=alpha,
                         edgecolor=edgecolor)

    # Add collection to axes
    ax.add_collection(pc)

    # Plot errorbars
    artists = ax.errorbar(xdata, ydata, xerr=xerror, yerr=yerror,
                          fmt='none', ecolor='k')

    return artists


# Create figure and axes
fig, ax = plt.subplots(1)

# Call function to create error boxes
_ = make_error_boxes(ax, x, y, xerr, yerr)

plt.show()

Riferimenti
L'uso delle seguenti funzioni, metodi, classi e moduli è mostrato in questo esempio: