Nota
Fare clic qui per scaricare il codice di esempio completo
Istogramma a dispersione (assi localizzabili) #
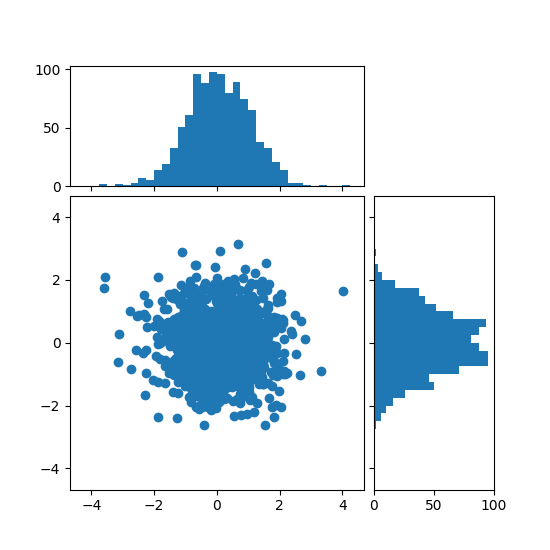
Mostra le distribuzioni marginali di un grafico a dispersione come istogrammi ai lati del grafico.
Per un buon allineamento degli assi principali con i marginali, le posizioni degli assi sono definite da a Divider, prodotto tramite make_axes_locatable. Si noti che l' DividerAPI consente di impostare le dimensioni degli assi e dei pad in pollici, che è la sua caratteristica principale.
Se si desidera impostare le dimensioni degli assi e dei pad rispetto alla figura principale, vedere l' esempio di grafico a dispersione con istogrammi .
import numpy as np
import matplotlib.pyplot as plt
from mpl_toolkits.axes_grid1 import make_axes_locatable

# Fixing random state for reproducibility
np.random.seed(19680801)

# the random data
x = np.random.randn(1000)
y = np.random.randn(1000)


fig, ax = plt.subplots(figsize=(5.5, 5.5))

# the scatter plot:
ax.scatter(x, y)

# Set aspect of the main axes.
ax.set_aspect(1.)

# create new axes on the right and on the top of the current axes
divider = make_axes_locatable(ax)
# below height and pad are in inches
ax_histx = divider.append_axes("top", 1.2, pad=0.1, sharex=ax)
ax_histy = divider.append_axes("right", 1.2, pad=0.1, sharey=ax)

# make some labels invisible
ax_histx.xaxis.set_tick_params(labelbottom=False)
ax_histy.yaxis.set_tick_params(labelleft=False)

# now determine nice limits by hand:
binwidth = 0.25
xymax = max(np.max(np.abs(x)), np.max(np.abs(y)))
lim = (int(xymax/binwidth) + 1)*binwidth

bins = np.arange(-lim, lim + binwidth, binwidth)
ax_histx.hist(x, bins=bins)
ax_histy.hist(y, bins=bins, orientation='horizontal')

# the xaxis of ax_histx and yaxis of ax_histy are shared with ax,
# thus there is no need to manually adjust the xlim and ylim of these
# axis.

ax_histx.set_yticks([0, 50, 100])
ax_histy.set_xticks([0, 50, 100])

plt.show()

Riferimenti
L'uso delle seguenti funzioni, metodi, classi e moduli è mostrato in questo esempio: