Nota
Fare clic qui per scaricare il codice di esempio completo
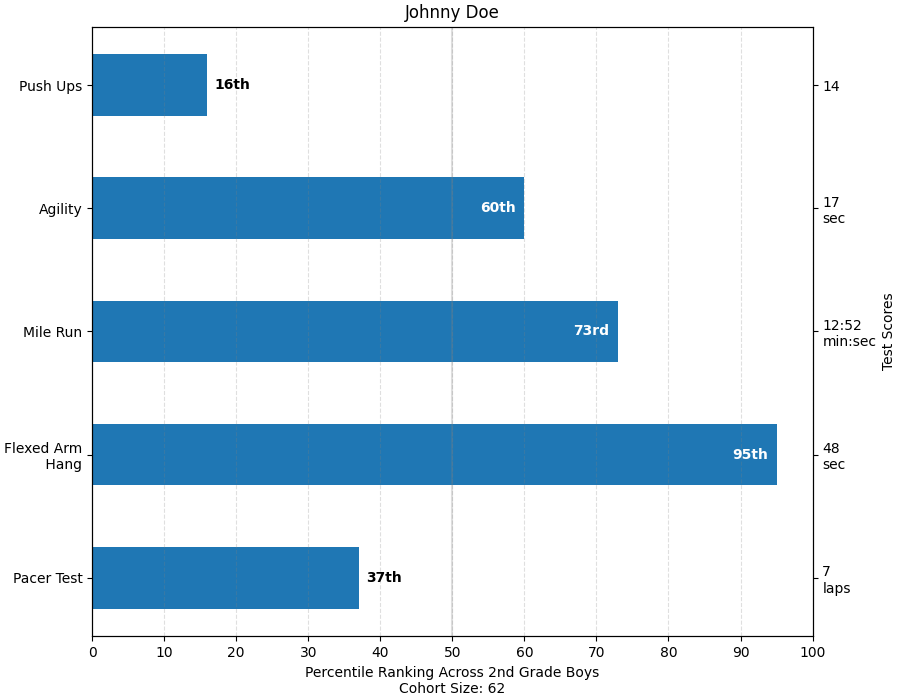
Percentili come grafico a barre orizzontali #
I grafici a barre sono utili per visualizzare conteggi o statistiche di riepilogo con barre di errore. Vedere anche il grafico a barre raggruppato con etichette o l' esempio di grafico a barre orizzontale per versioni più semplici di queste funzioni.
Questo esempio proviene da un'applicazione in cui gli insegnanti di ginnastica delle scuole elementari volevano essere in grado di mostrare ai genitori come si comportava il loro bambino attraverso una manciata di test di fitness e, soprattutto, rispetto a come facevano gli altri bambini. Per estrarre il codice di tracciamento a scopo dimostrativo, creeremo alcuni dati per il piccolo Johnny Doe.
from collections import namedtuple
import numpy as np
import matplotlib.pyplot as plt


Student = namedtuple('Student', ['name', 'grade', 'gender'])
Score = namedtuple('Score', ['value', 'unit', 'percentile'])


def to_ordinal(num):
    """Convert an integer to an ordinal string, e.g. 2 -> '2nd'."""
    suffixes = {str(i): v
                for i, v in enumerate(['th', 'st', 'nd', 'rd', 'th',
                                       'th', 'th', 'th', 'th', 'th'])}
    v = str(num)
    # special case early teens
    if v in {'11', '12', '13'}:
        return v + 'th'
    return v + suffixes[v[-1]]


def format_score(score):
    """
    Create score labels for the right y-axis as the test name followed by the
    measurement unit (if any), split over two lines.
    """
    return f'{score.value}\n{score.unit}' if score.unit else str(score.value)


def plot_student_results(student, scores_by_test, cohort_size):
    fig, ax1 = plt.subplots(figsize=(9, 7), constrained_layout=True)
    fig.canvas.manager.set_window_title('Eldorado K-8 Fitness Chart')

    ax1.set_title(student.name)
    ax1.set_xlabel(
        'Percentile Ranking Across {grade} Grade {gender}s\n'
        'Cohort Size: {cohort_size}'.format(
            grade=to_ordinal(student.grade),
            gender=student.gender.title(),
            cohort_size=cohort_size))

    test_names = list(scores_by_test.keys())
    percentiles = [score.percentile for score in scores_by_test.values()]

    rects = ax1.barh(test_names, percentiles, align='center', height=0.5)
    # Partition the percentile values to be able to draw large numbers in
    # white within the bar, and small numbers in black outside the bar.
    large_percentiles = [to_ordinal(p) if p > 40 else '' for p in percentiles]
    small_percentiles = [to_ordinal(p) if p <= 40 else '' for p in percentiles]
    ax1.bar_label(rects, small_percentiles,
                  padding=5, color='black', fontweight='bold')
    ax1.bar_label(rects, large_percentiles,
                  padding=-32, color='white', fontweight='bold')

    ax1.set_xlim([0, 100])
    ax1.set_xticks([0, 10, 20, 30, 40, 50, 60, 70, 80, 90, 100])
    ax1.xaxis.grid(True, linestyle='--', which='major',
                   color='grey', alpha=.25)
    ax1.axvline(50, color='grey', alpha=0.25)  # median position

    # Set the right-hand Y-axis ticks and labels
    ax2 = ax1.twinx()
    # Set equal limits on both yaxis so that the ticks line up
    ax2.set_ylim(ax1.get_ylim())
    # Set the tick locations and labels
    ax2.set_yticks(
        np.arange(len(scores_by_test)),
        labels=[format_score(score) for score in scores_by_test.values()])

    ax2.set_ylabel('Test Scores')


student = Student(name='Johnny Doe', grade=2, gender='Boy')
scores_by_test = {
    'Pacer Test': Score(7, 'laps', percentile=37),
    'Flexed Arm\n Hang': Score(48, 'sec', percentile=95),
    'Mile Run': Score('12:52', 'min:sec', percentile=73),
    'Agility': Score(17, 'sec', percentile=60),
    'Push Ups': Score(14, '', percentile=16),
}

plot_student_results(student, scores_by_test, cohort_size=62)
plt.show()

Riferimenti
L'uso delle seguenti funzioni, metodi, classi e moduli è mostrato in questo esempio: